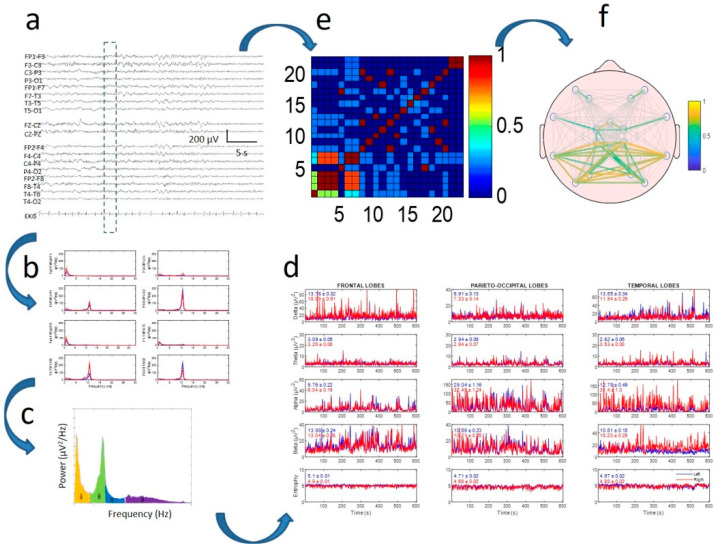
Figure 1.
Method of electroencephalogram (EEG) quantification in two branches: power spectra (b–d) and synchronization (e,f). (a) Raw EEG tracing. Discontinuous rectangle shows moving window used for analysis; (b) power spectra for every channel; (c) areas for delta, theta, alpha, and beta bands under spectrum highlighted in different colors; (d) dynamics of four bands (and entropy in lower row) for every lobe. Mean and standard error of the mean (SEM) values for every tracing are displayed inside every graph. Red and blue lines indicate right and left hemispheres, respectively; (e) correlation matrix for window; (f) mean correlation computed for all recordings.

