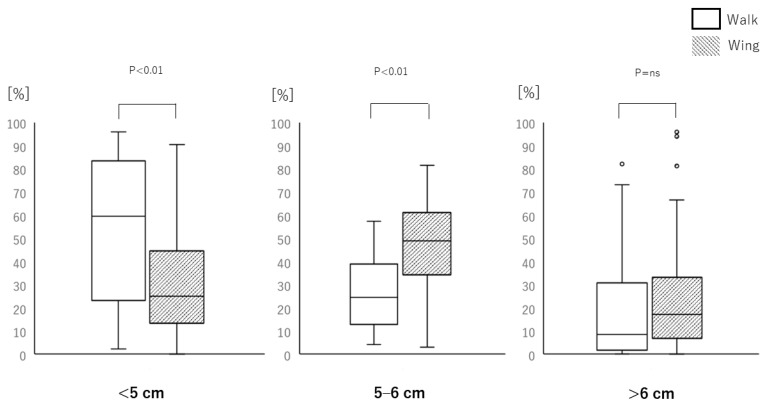
Figure 4.
Data categorizing the percent of chest compression depths (<5 cm, 5–6 cm, or >6 cm) achieved with the walk (white bar) and wing (grey bar) methods. The central boxes represent values from the lower to upper quartile (25th to 75th percentile) within each group. The middle horizontal lines represent the median (50th percentile), and the whiskers represent the 5th and 95th percentiles. The white bars represent the walk method and the grey bars represent the wing method. The p-values above each category show whether there was a significant difference between the methods. The data were analyzed by Wilcoxon-signed rank test.

