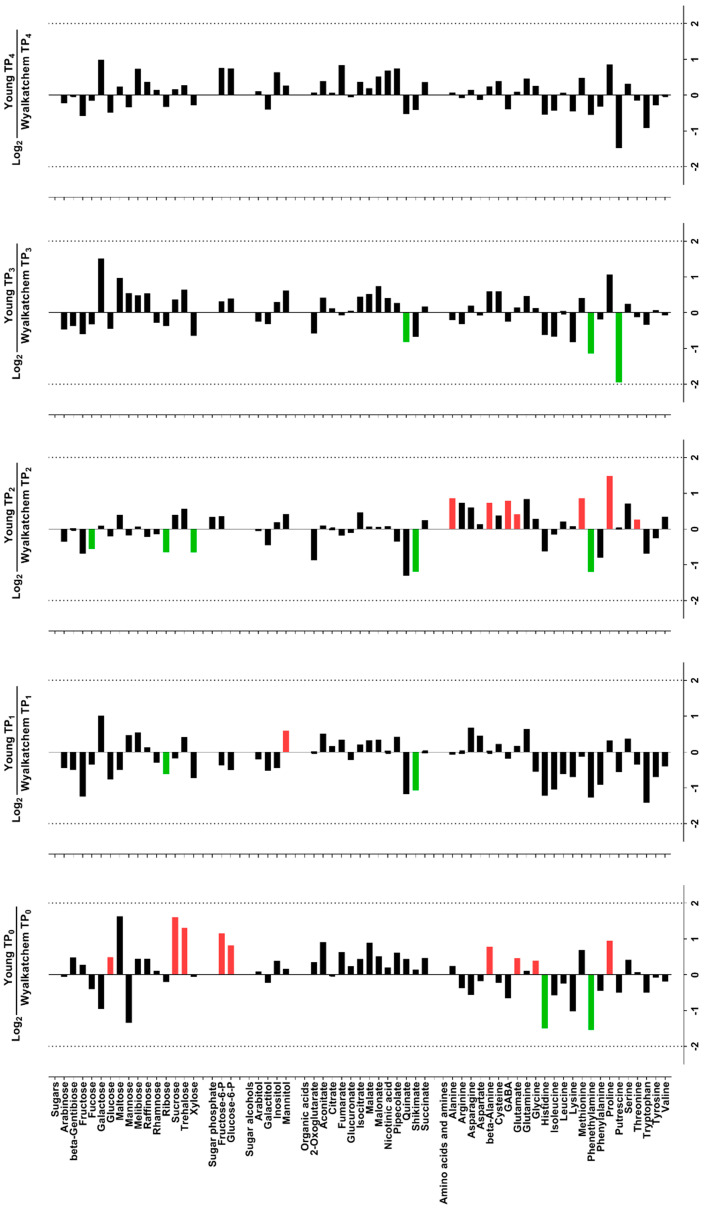
Figure 3.
Log2-fold changes of primary metabolites in spikes of cold-tolerant Young (Y) compared to cold-sensitive Wyalkatchem (W) at each time point. Fold changes were calculated by dividing the concentration of Young by the concentration of Wyalkatchem at each time point, followed by log2-transformation. FDR-adjusted p-value of 0.05 was set as the cut-off. Green = significantly lower in Young, or higher in Wyalkatchem; red = significantly higher in Young, or lower in Wyalkatchem. n = 3.

