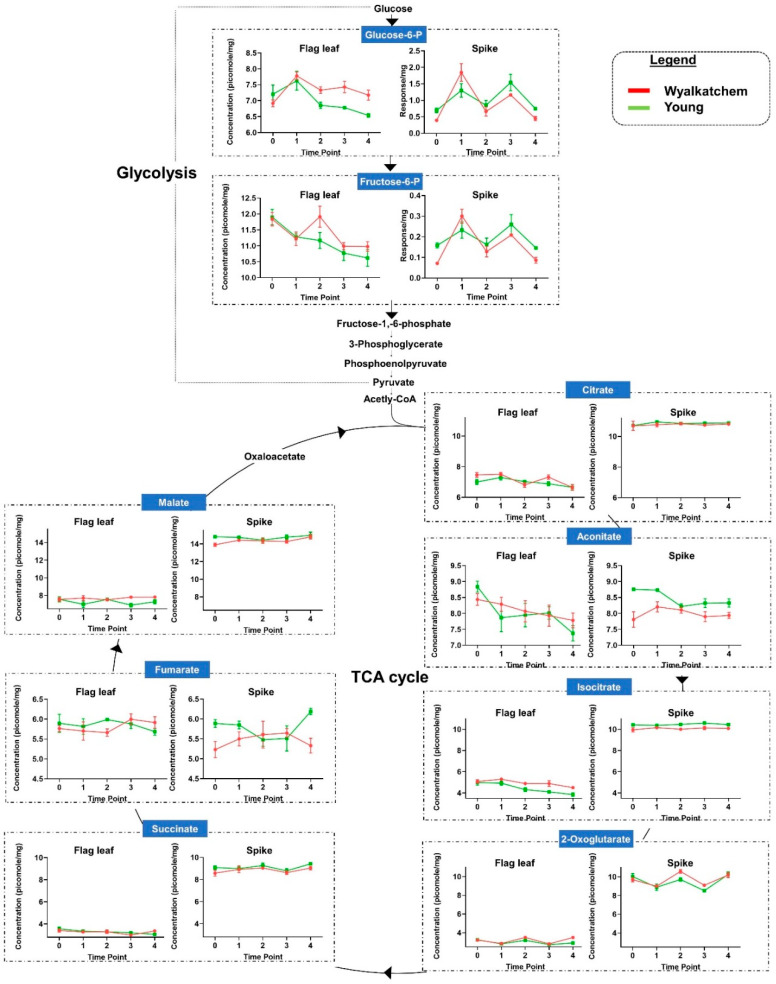
Figure 6.
Comparison of primary metabolites involved in glycolysis and the tricarboxylic acid cycle (TCA) cycle, the two main energy-providing pathways of the cell. The graphs show differences in relevant primary metabolite concentrations (picomole/mg of fresh weight, Log2-transformed) between flag leaf and spike metabolite data. For glucose-6-phosphate and fructose-6-phosphate, the spike data compare the response normalized per mg of fresh weight. The graphs reveal differences in accumulation levels of these metabolites in cold-tolerant Young and cold-sensitive Wyalkatchem spikes. n = 4 ± SEM for flag leaf, n = 3 ± SEM for spike.

