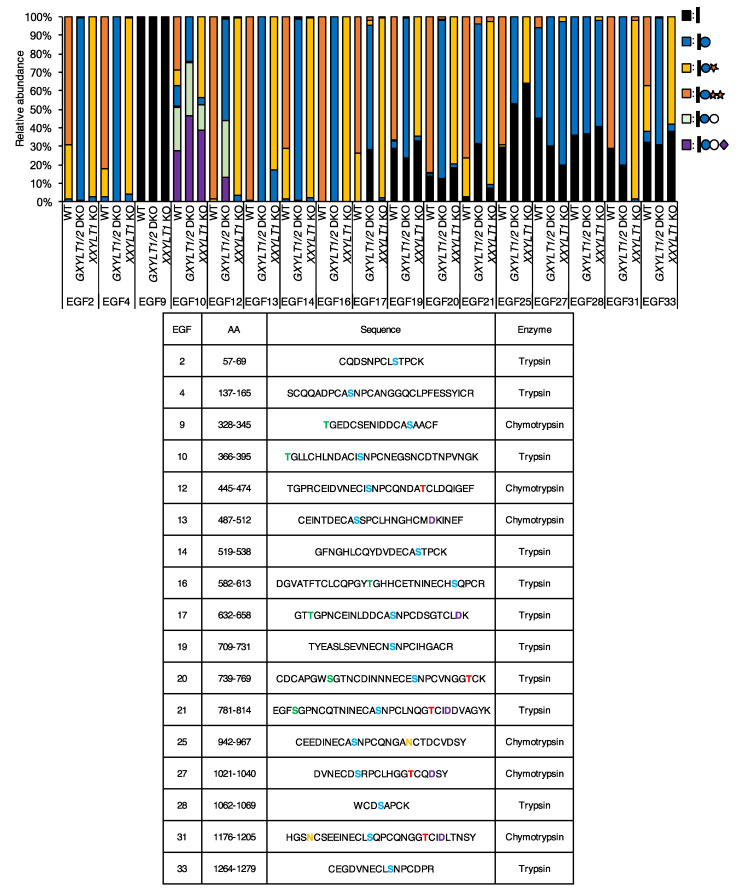
Figure 2.
Epidermal growth factor-like (EGF) repeats from NOTCH1 are modified with O-Glc trisaccharides. Mass spectrometric analysis of O-Glc glycans on mouse NOTCH1 produced in wild type control cells, GXYLT1/2 double knockout (DKO) cells, and XXYLT1 knockout (KO) cells. Samples were generated in wild type control HEK293T cells, GXYLT1/2 DKO cells, and XXYLT1 KO cells transfected with the plasmids encoding the mouse NOTCH1 ECDs as described in Experimental Procedures. The data are derived from the analysis of mouse NOTCH1 EGF1-18, mouse NOTCH1 EGF19-36, and mouse NOTCH1 EGF24-28. MS/MS spectra confirmed the identity of (glyco)peptides based on the presence of peptide-specific b- and y-ions and the neutral loss of the predicted glycans. Spectra of MS/MS are shown in Figure S1. The sequence of peptides, the predicted and measured mass (m/z), and the charge state are summarized in Table S1. Quantification was performed using the height of the EICs and the total amount of detected (glyco)peptides with different glycoforms is set at 100%. Data are derived from at least two biological replicates. Further details are shown in Table S1. Colored letters in the sequences of the table show the predicted post-translational modification sites. Blue—O-Glc; red—O-Fuc; green—O-GlcNAc; yellow—N-glycan; purple—β-hydroxylation.

