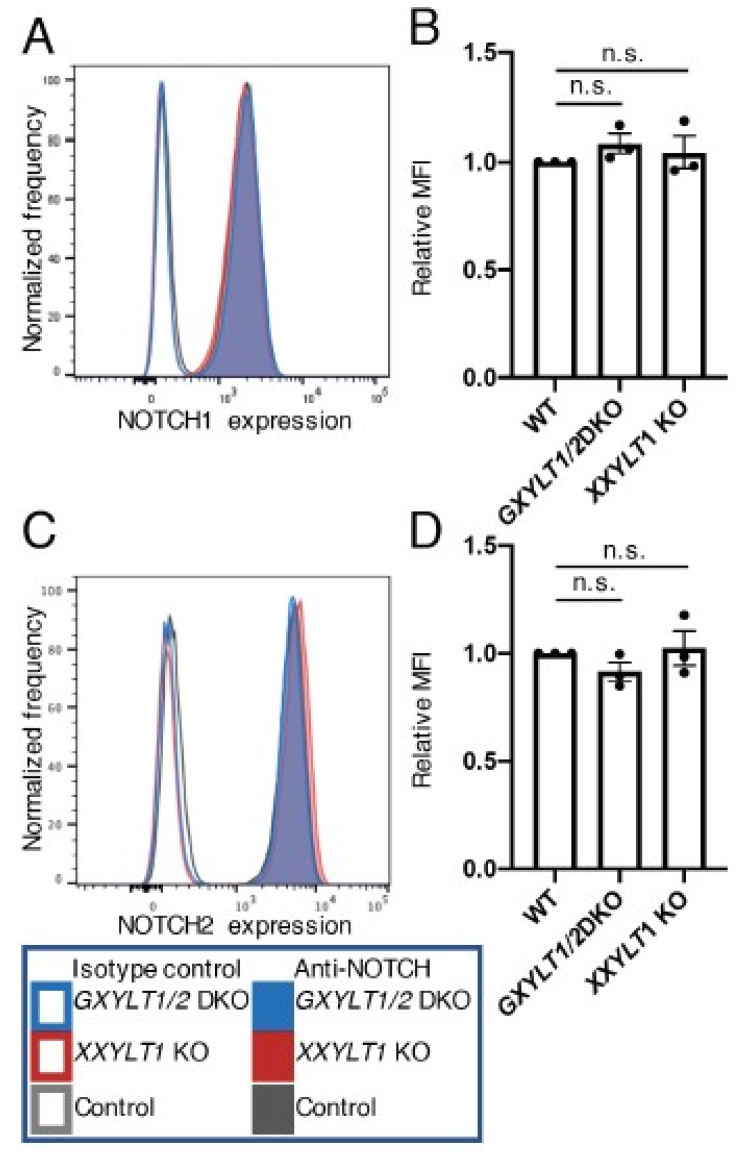
Figure 4.
XYLTs are not required for the cell surface expression of endogenous NOTCH1 and NOTCH2 in HEK293T cells. (A) Histograms of endogenous NOTCH1 expression in wild type and XYLTs’ KO clones of HEK293T cells analyzed by flow cytometry. (B) Mean fluorescence intensity from (A). Plots are from three independent experiments (n = 3). Error bar denotes the standard error of the mean (SEM). Bar graphs show the average ± SEM. (C) Histograms of endogenous NOTCH2 expression in wild type and XYLTs’ KO clones of HEK293T cells analyzed by flow cytometry. (D) Mean fluorescence intensity from (C). Plots are from three independent experiments (n = 3). Bar graphs show the average ± SEM. The cell numbers on the vertical axis of the graphs for (A,C) are normalized with the mode value. n.s., not significant (p > 0.05).

