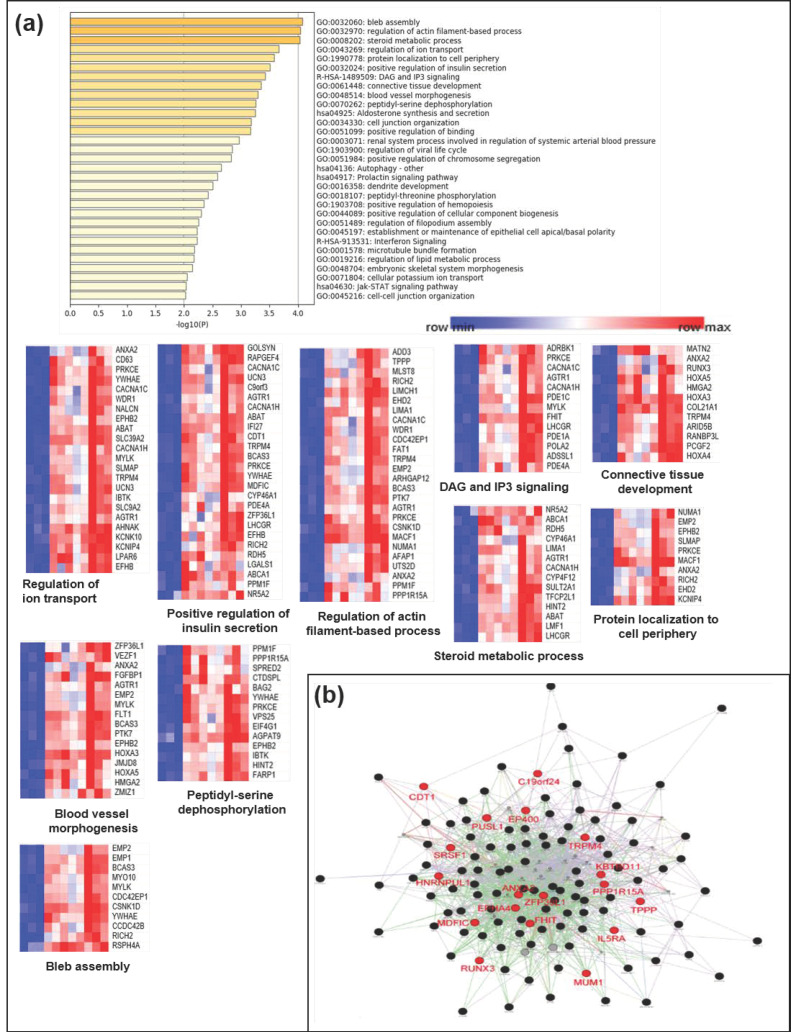
Figure 5.
Biological functional implication of hypermethylated genes in CD. (a) Gene ontology (GO) analysis was conducted using Metascape and (b) GeneMANIA with genes that were proximal to the 143 hypermethylated genes (>2.5-fold increase). Each heatmap of the implicated biological pathways indicates those pathways significantly associated with the genes in the network. Similar terms tend to be clustered in the plot. The size of the circle depicts whether a given term is a more general GO term (larger) or a more specific term (smaller). The 19 hypermethylated candidate genes (>3-fold increase) are indicated in red.

