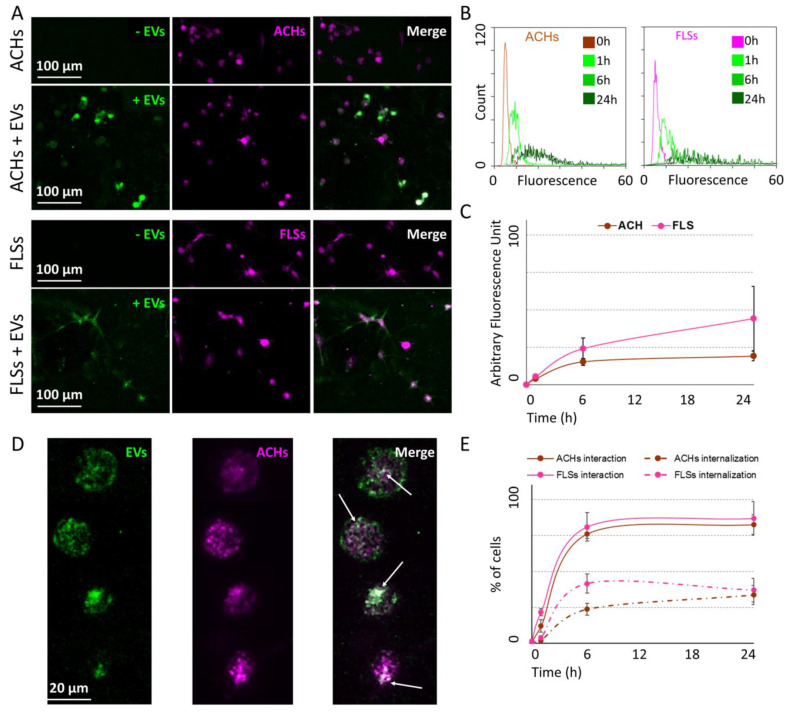
Figure 5.
ASC-EV interaction with and incorporation in ACHs and FLSs over time in 3D microfluidic devices. (A) Pictures at time 0 and after 24 h of ACHs and FLSs grown in 3D chips and incubated with ASC-EVs. EVs were CFSE-stained and are shown in green, whereas cells were stained with CellTracker™ Deep Red Dye and are shown in violet. The merged pictures clearly show the overlapping of the signal of ASC-EVs with cells. One representative donor is shown. (B) Green fluorescence intensity at different time points of ACHs and FLSs incubated or not with ASC-EVs inside the 3D microfluidic device. (C) The trend over time of mean green fluorescence of ACHs and FLSs incubated with ASC-EVs. N = 3, values are shown as mean ± SE. Significance for p-value < 0.05. (D) Representative pictures of ASC-EVs (green) incubated with ACHs (violet) after 24 h in 3D microfluidic device. EVs clearly surrounded ACHs and were also internalized, as indicated in the merge pictures by the white arrows. (E) Trend over time of the number of cells either interacting with ASC-EVs regardless outside or inside (continuous line) or with internalization (dashed line). N = 3, values are shown as mean ± SE. Significance for p-value < 0.05.

