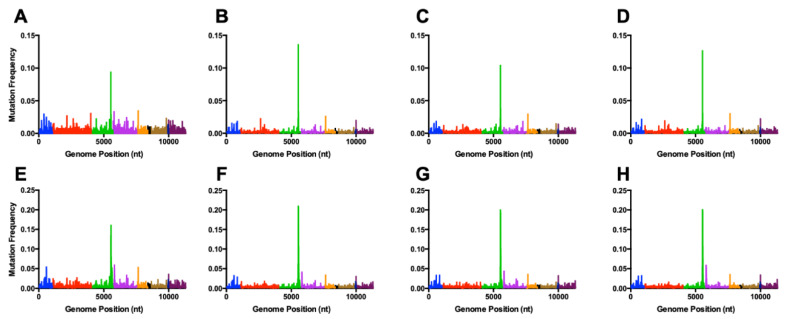
Figure 4.
Mutation frequency of VEEV TC-83 E3Δ56-59 mutants at coding regions across the genome. VEEV TC-83 E3Δ56-59 (A,E), VEEV TC-83 E3Δ56-59 nsP4-G14R (B,F), VEEV TC-83 E3Δ56-59 nsP4-A96T (C,G), and VEEV TC-83 E3Δ56-59 nsP4-C488Y (D,H). Panels A-D have been analyzed using Analysis A. Panels E-H have been analyzed using Analysis B. Graphs show a representative of each specific mutant. Blue = nsP1, red = nsP2, green = nsP3, purple = nsP4, orange = capsid, black = E3, gold = E2, navy blue = 6k, maroon = E1.

