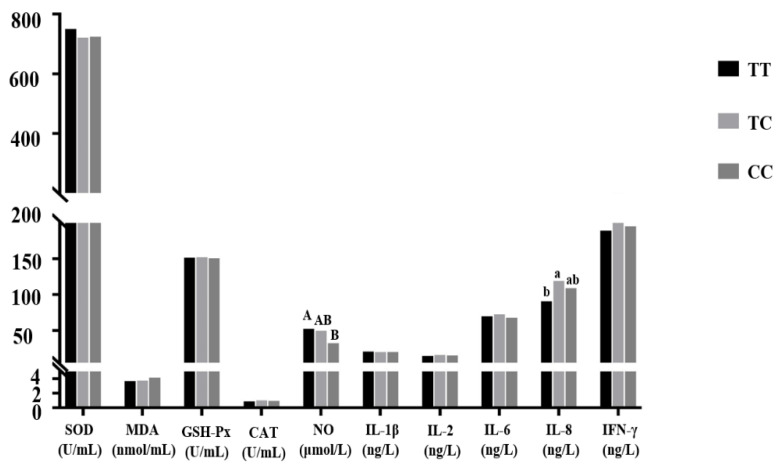
Figure 3.
Correlation analysis between each genotype of the IL-8 gene T–550C mutation and coccidiosis resistance indexes. Note: Different uppercase letters in the same indexes indicate significant differences (p < 0.01); different lowercase letters in the same indexes indicate significant differences (p < 0.05); the same or no letters indicate no significant differences (p > 0.05). The number of individuals of each genotype is shown in brackets. The same representation is used in Figure 4, Figure 5, Figure 6 and Figure 7.

