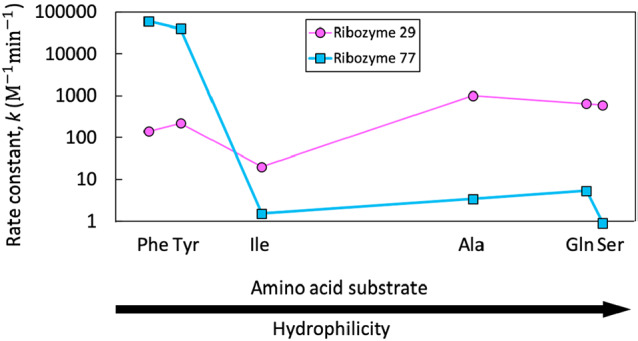
Figure 3.

Promiscuity profiles for two aminoacylation ribozymes. Promiscuity profiles for ribozyme 77 (blue squares) and ribozyme 29 (pink circles) show catalytic rates for each tested amino acid substrate,78 ordered by hydrophilicity as defined by Hopp and Woods91,92 (Phe = −2.5, Tyr = −2.3, Ile = −1.8, Ala = −0.5, Gln = 0.2, and Ser = 0.3). Also see Table 1.
