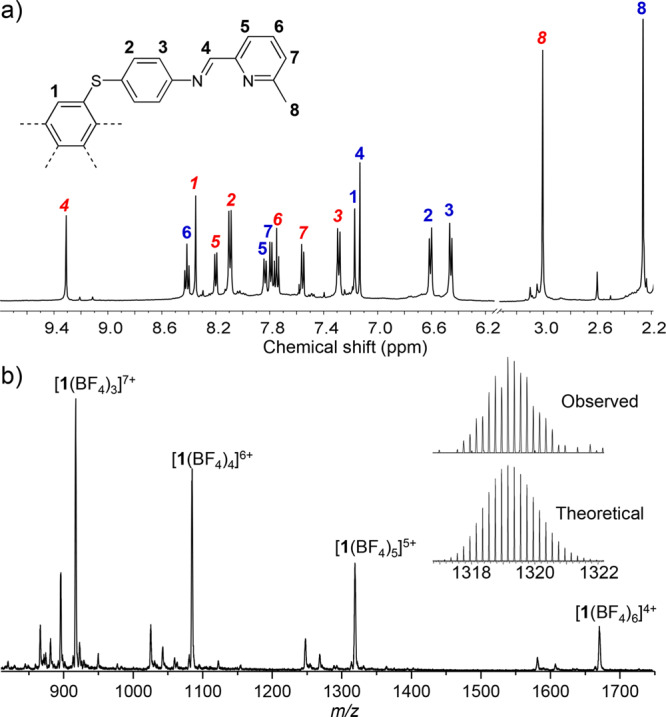
Figure 2.

(a) 1H NMR spectra (500 MHz, CD3CN, 298 K) of 1. Peak assignments for the interior and exterior ligands are marked with bold blue and italic red labels, respectively. (b) ESI-MS spectrum of 1. The inset shows the theoretical and observed isotope patterns for the +5 peak.
