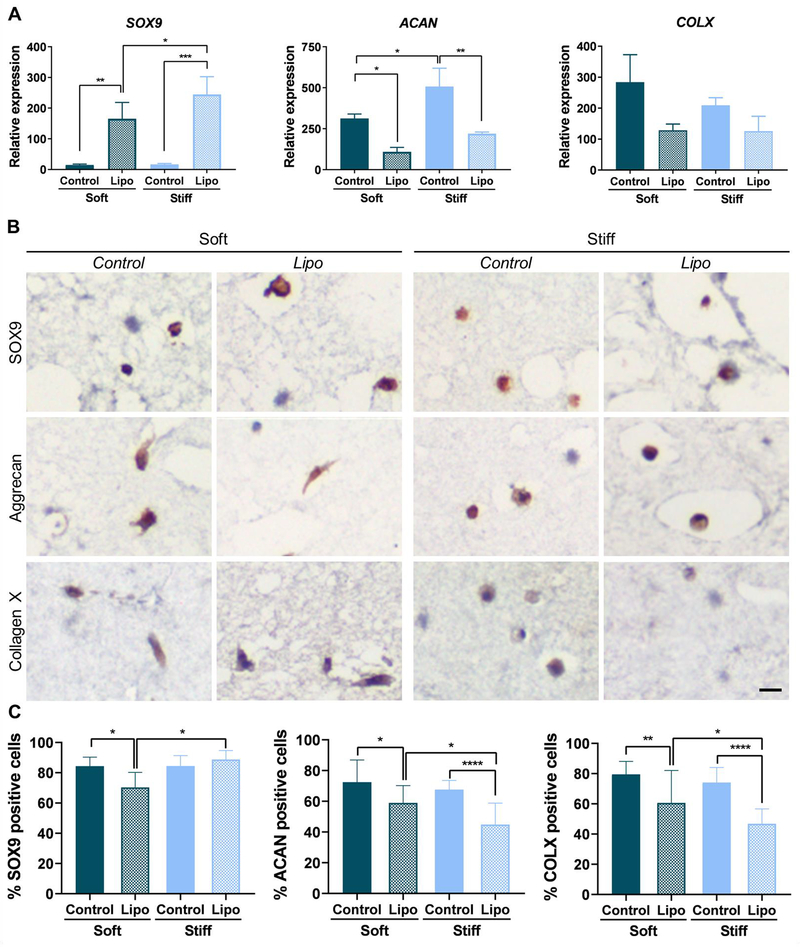
Figure 4.
SOX9 2D transfection and subsequent encapsulation of adipose MSCs within the IPNs results in the reduction of collagen type-X expression. (A) Gene expression of chondrogenic markers SOX9, aggrecan (ACAN) and collagen type-X (COLX). Gene expression levels were measured by qRT-PCR, normalized to GAPDH expression and compared to the levels in MSCs before encapsulation (One-way ANOVA, *P≤0.05, **P≤0.01, ***P≤0.001, n=3). (B) Immunostaining for SOX9, aggrecan and collagen type-X in IPN sections.Scale bar = 500 μm for all the images (C) Quantification of positive cells in immunostained sections (One-way ANOVA, ****P≤0.0001, n =3). Soft designates MSCs encapsulated within soft 1:2 IPNs, Control designates MSCs encapsulated within stiff 1:2 IPNs and Lipo designates MSCs transfected with SOX9 in 2D before encapsulation within stiff 1:2 IPNs. Data represent the mean ±SD. Control and Lipo designate the IPNs loaded with non-transfected and transfected cells, respectively. See also figure S13 for lower magnification immunohistochemistry images.

