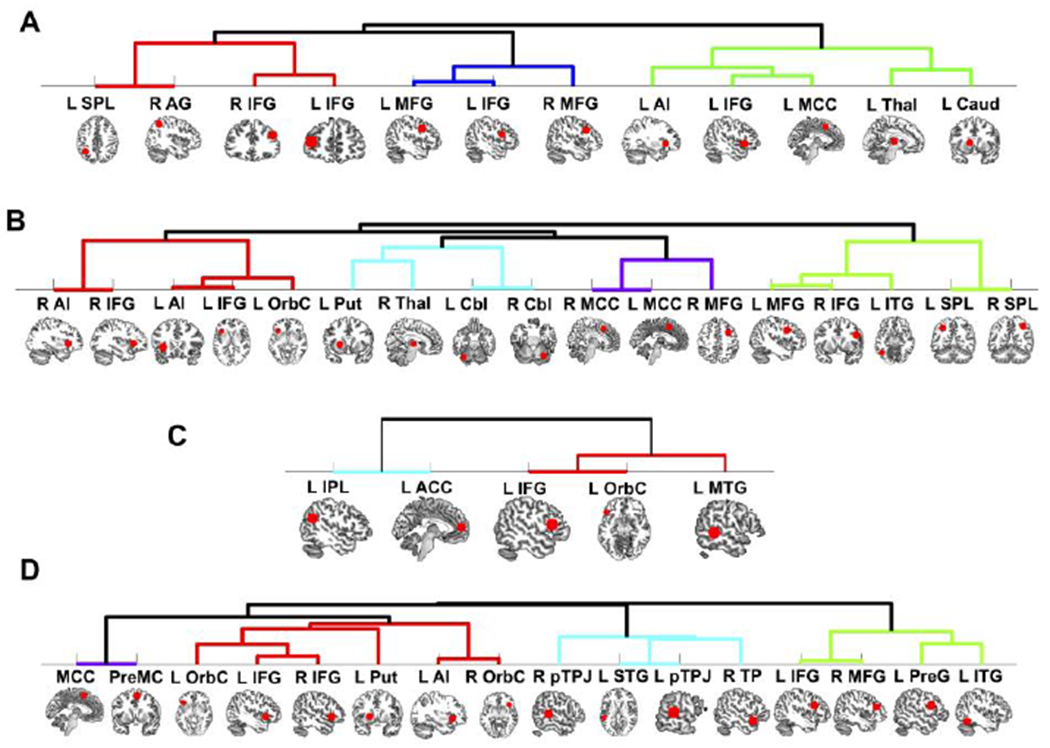
Figure 6. Hierarchical clustering analyses.

Results from the clustering analyses based on the RSFC profiles of the meta-analytic clusters for SOP (A), SPP (B), TPP (C) and for the overlapping regions of the SPP and TPP results (D).
L, left; R, right; AG, angular gyrus; Thai, thalamus; Caud, caudate; Cbl, cerebellum; IPL, inferior parietal lobule; SPL, superior parietal lobule; IFG, inferior frontal gyrus; OrbC, orbital cortex; MTG, middle temporal gyrus; MCC, middle cingulate cortex; PreMC, premotor cortex; Put, putamen; STG, superior temporal gyrus; TP, temporal pole; MFG, middle frontal gyrus; PreG, precentral gyrus; ITG, inferior temporal gyrus.
