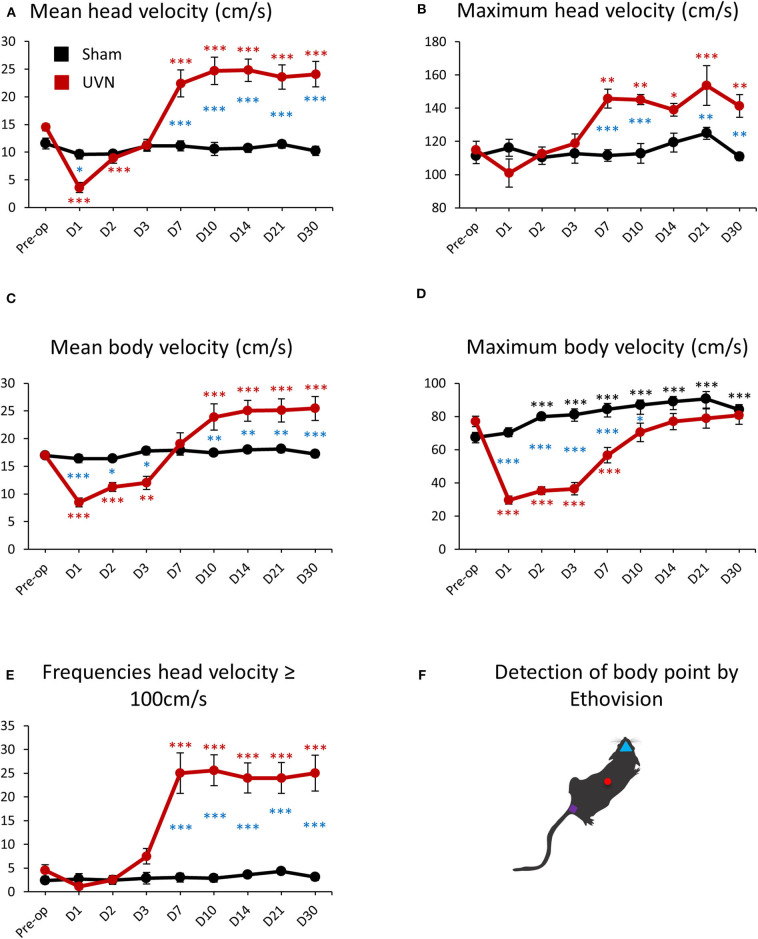
Figure 6.
Locomotor velocity of UVN and Sham rats in the open field. (A) Curves illustrating the kinetics of the mean velocity (cm/s) of the head (calculated from the nose point) for UVN (red) and Sham (black) group. (B) Curves illustrating the kinetics of the maximum velocity (cm/s) of the head for UVN (red) and Sham (black) group. (C) Curves illustrating the kinetics of the mean velocity (cm/s) of the body (calculated from the center-point) for UVN (red) and Sham (black) group. (D) Curves illustrating the kinetics of the maximum velocity (cm/s) of the body for UVN (red) and Sham (black) group. (E) Curves illustrating the kinetics of the frequencies of the velocity of the head superior or equal to 100 cm/s, linked to the bobbing behavior (cephalic nystagmus) for UVN (red) and Sham (black) group. Bobbing behavior is defined when the velocity for the nose point is ≥ 100 cm/s. (F) illustration of the detection of body point by Ethovision™ throughout the recordings: nose point (blue triangle), center point (red circle), and tail base (purple square) of each animal. Data represent mean ± SEM; *P < 0.05, **P < 0.01, ***P < 0.001. A significant difference from the pre-operative value is indicated by * in black for the SHAM group. A significant difference from the pre-operative value is indicated by * in red for the UVN group. A significant difference between the SHAM and the UVN group is indicated with * in blue.

