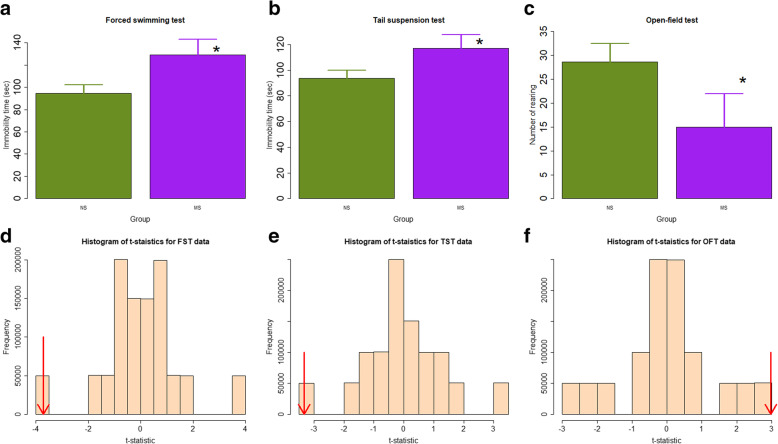
Fig. 1.
Summary of behavioral test results. a Difference in mean immobility time of the forced swimming test; b Mean immobility time of the tail suspension test, and c Average rearing number of mice in the open field test between the two groups. n = 3 in each group. NS: non-separated; MS: maternal separation. Data are presented in mean ± SD. Symbols for the statistical significance level: *: p < 0.05; #: p = 0.057. Permutation test results, based on one million permutations, for the t-statistics for the data of forced swimming test (d), tail suspension test (e), and open field test (f). The red arrows indicate the calculated t-statistic for the original data

