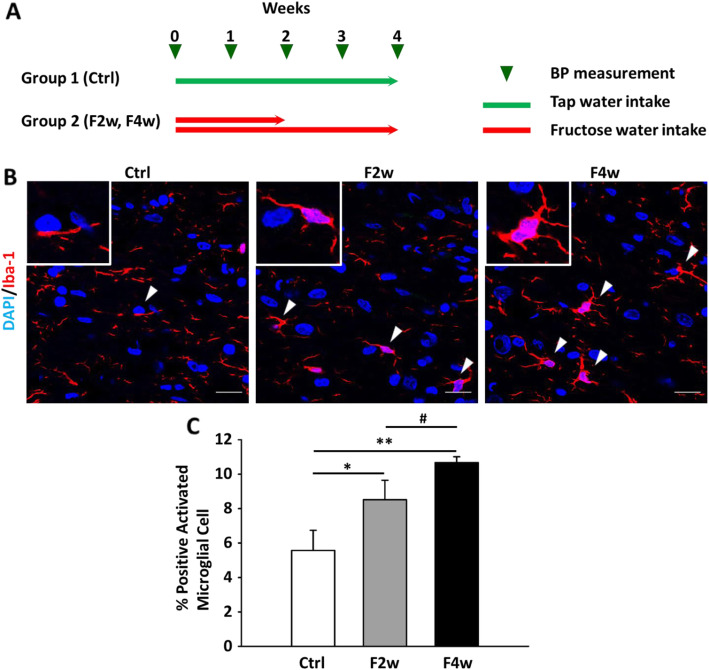
Fig. 1.
Quantitative immunofluorescent analysis of microglial marker in the NTS following feeding with 10% fructose. a Flowchart presented animal experimental design. b In situ qualitative analysis of the microglial marker Iba-1 by immunofluorescent staining. The arrowhead indicates activated microglial cells. The scale bar represents 20 μm. c Graphs depicting quantitative analysis of in situ positive cells in the NTS of WKY rats after fructose feeding. The percentage of the positive cells was determined by counting positive cells in each hemisphere of the NTS at 400 × magnification. The values are presented as mean ± SEM. One-way ANOVA with Bonferroni’s post-hoc was performed for statistical analysis.*P < 0.05, **P < 0.01 compared to the control group, #P < 0.05 compared to fructose feeding for 4 weeks (n = 6~8 per group)

