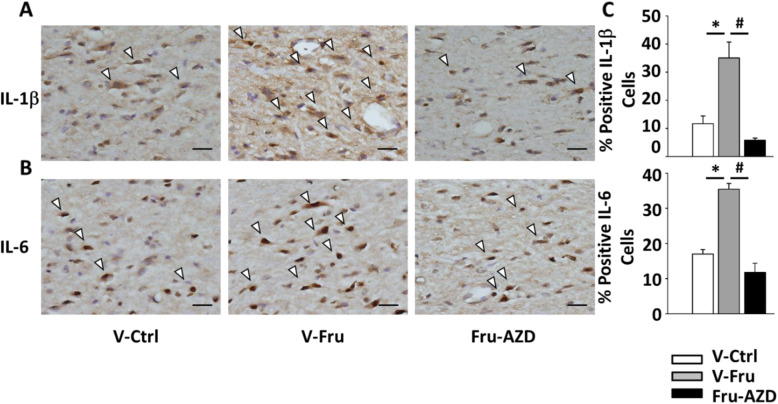
Fig. 5.
In situ quantitative immunohistochemical analysis of pro-inflammatory cytokines in the NTS following feeding with 10% fructose and AZD8797 treatment. a Qualitative analysis of IL-1β and IL-6 were observed by immunohistochemical staining after administration of the CX3CR1 inhibitor AZD8797. The arrowhead indicates positive cells as a representative. The scale bar presents 50 μm. b Graphs depicting the quantitative analysis of the in situ cytokine-positive cells. The percentage was determined by counting pro-inflammatory positive cells in each hemisphere of the NTS at 200 × magnification. One-way ANOVA with Scheffe’s post-hoc was performed for statistical analysis. The values are represented as mean ± SEM. *P < 0.05 compared to control rats and #P < 0.05 compared to fructose-fed rats (n = 6~8 per group)

