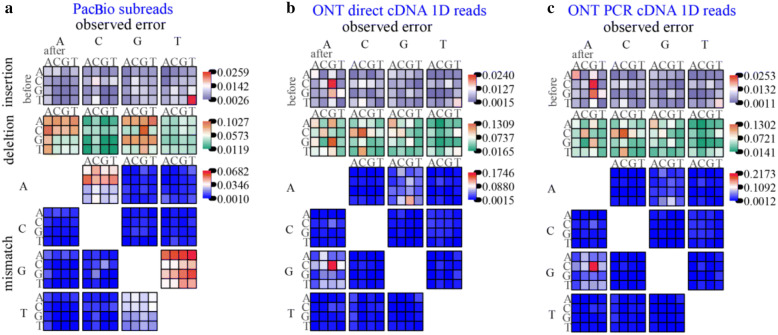
Fig. 3.
Context-specific errors. Context-specific errors of a PacBio subreads, b ONT Dc 1D reads, and c ONT Pc 1D reads. The error types shown are insertions, deletions, and mismatches. For insertions (deletions), the large base above the plot indicates the inserted (deleted) base. For mismatch errors, the large base to the left (above) indicates the expected (observed) base. Blocks of coloured tiles show the error frequency in specific contexts for each error; the small base to the left (above) indicates the base preceding (following) the error. Error frequency is plotted on separate scales for insertions, deletions, and mismatches

