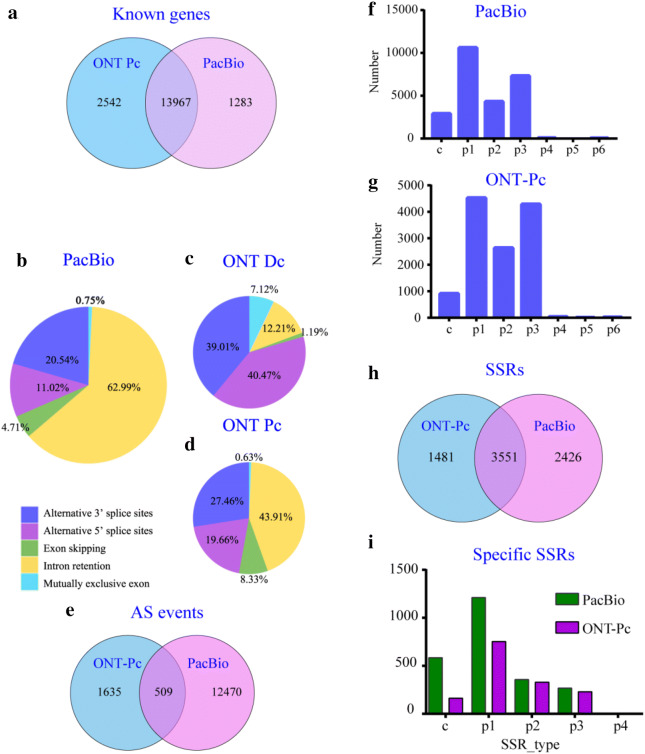
Fig. 4.
Multiple analyses of genes, AS events and SSRs. a Venn chart showing the numbers of known genes identified in PacBio and ONT Pc. b–d Alternative splicing event distribution of PacBio (b) ONT Dc (c) and ONT Pc (d) data. e Venn chart showing the numbers of AS events detected in PacBio and ONT Pc. f–g Distribution of different SSR type from PacBio (f) and ONT Pc (g) technologies. h Venn chart showing the numbers of SSR screened in PacBio and ONT Pc. i Distribution of different SSR type of specific SSR identifying in PacBio (green) and ONT Pc (purple). c, compound SSR, the length beween the different SSR < 100 bp; p1, Mono-nucleotide repeat; p2, Di-nucleotide repeat; p3, Tri-nucleotide repeat; p4, Tetra-nucleotide repeat; p5, Penta-nucleotide repeat; p6, Hexa-nucleotide repeat

