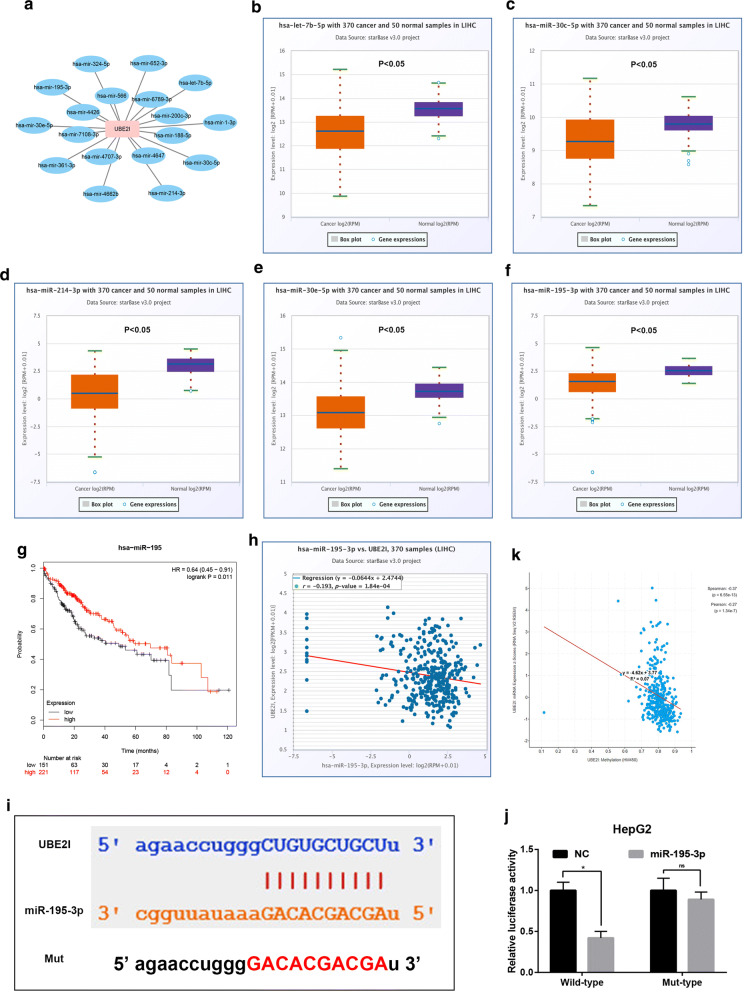
Fig. 6.
The dysregulated mechanisms of UBE2I in HCC. a The potential miRNAs-UBE2I regulatory network established by Cytoscape software (Version 3.6.0). b The expression level of hsa-let-7b-5p in HCC determined by starBase database. c The expression level of hsa-miR-30c-5p in HCC determined by starBase database. d The expression level of hsa-miR-214-3p in HCC determined by starBase database. e The expression level of hsa-miR-30e-5p in HCC determined by starBase database. f The expression level of hsa-miR-195-3p in HCC determined by starBase database. P-value < 0.05 was considered as statistically significant. g The prognostic value of has-miR-195-3p in HCC determined by Kaplan–Meier plotter. Logrank P-value < 0.05 was considered as statistically significant. h The expression correlation between UBE2I and hsa-miR-195-3p in HCC determined by starBase database. i The relationship between UBE2I promoter methylation level and UBE2I mRNA expression in HCC determined by cBioPortal database. j The binding sites of has-miR-193-5p and UBE2I was predicted by starBase and the mutant binding sequences for miR-193-5p in the 3′-UTR of UBE2I were also shown. k Luciferase activity was detected in HepG2 by co-transfected with a reporter plasmid carrying the wild-type or mut-type UBE2I 3′-UTR and either the miR-195-3p mimics or miR-NC. P-value < 0.05 was considered as statistically significant. “ns” represented no significant

