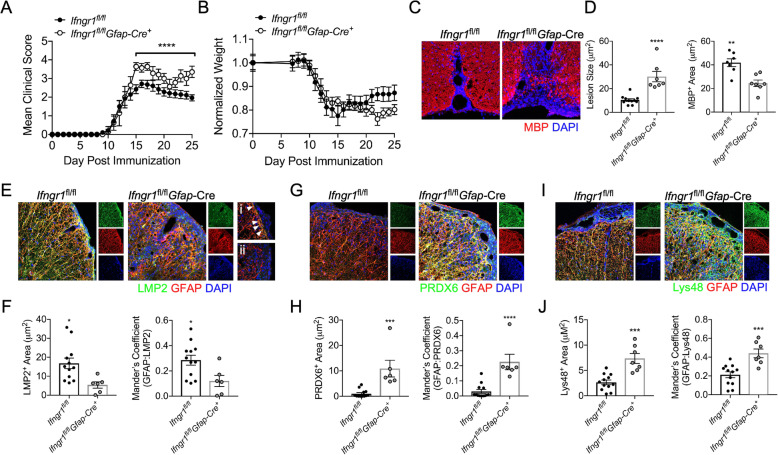
Fig. 5.
Astrocyte IFNγ signaling upregulates the iP during EAE. EAE was induced in Ifngr1fl/flGfap-Cre+ mice (n = 7) and Ifngr1fl/fl littermates (n = 12) and (a) EAE clinical course and (b) weight loss were blindly monitored. Following 25 days post-immunization, mice were perfused, and the CNS was removed and cryopreserved for IHC analysis. Ventral white matter tracts of the lumbar spinal cord were imaged using confocal microscopy at 20 a magnification. c Tissue sections were labeled for MBP (red), and nuclei were counterstained with DAPI (blue). d Lesion area and MBP+ area were quantified. e Tissue sections were labeled for LMP2 (green), GFAP (red), and nuclei were counterstained with DAPI (blue). Spinal cord sections from (i) Ifngr1fl/fl and (ii) Ifngr1fl/flGfap-Cre+ mice were imaged at 63 × magnification, and areas of LMP2/GFAP colocalization are indicated (white arrows). f Total LMP2 area and LMP2 colocalized with GFAP were analyzed. g Tissue sections were labeled for PRDX6 (green) and GFAP (red), and nuclei were counterstained with DAPI (blue). h Total PRDX6 area and PRDX6 colocalized with GFAP were analyzed. i Tissue sections were labeled for Lys48 (green) and GFAP (red), and nuclei were counterstained with DAPI (blue). j Total Lys48 area and Lys48 colocalized with GFAP were analyzed. Data in (a) represent the mean ± SEM combined from 2 independent experiments and were analyzed by Mann–Whitney U test for nonparametric data. Data in c–j represent the mean ± SEM combined from 2 independent experiments and were analyzed by 2-tailed Student’s t test. *P < 0.05, **P < 0.01, ***P < 0.001, ****P < 0.0001

