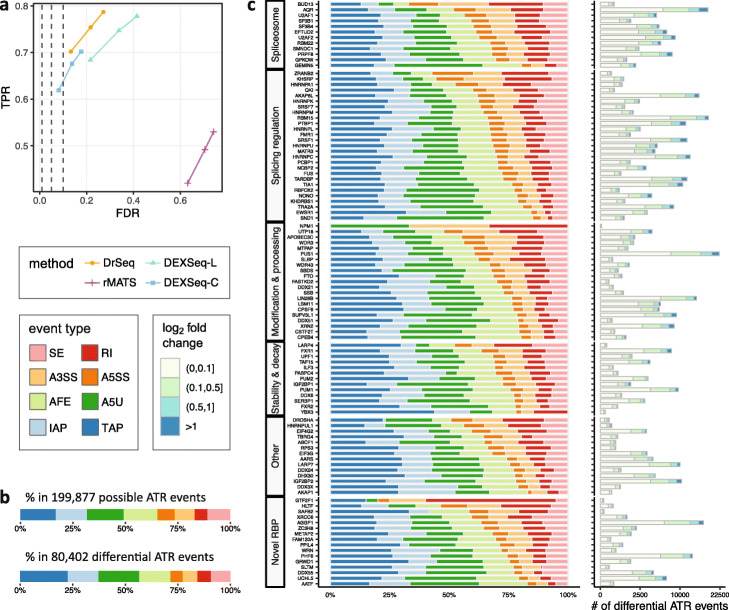
Fig. 3.
Detection of differential ATR events from RNA-seq data by DrSeq of SURF. a Comparison of the performances of DrSeq, rMATS, and two simple strategies for stitching DEXSeq inferences into ATR level (DEXSeq-L and DEXSeq-C), using simulated RNA-seq data. For each method, the three points display the true positive rate (TPR) and observed false discovery rate (FDR) at target FDR levels of 0.01, 0.05, and 0.1, respectively. b The distribution of eight event types in (upper panel) all 216,140 possible ATR events parsed from human genome annotation file (GENCODE version 24) and (lower panel) a total of 83,839 differential ATR events identified by DrSeq in at least one of the comparisons of 104 shRNA-seq experiments versus wild-type control (after duplication removal). c The distribution of differential ATR events identified by DrSeq in 104 RBP knockdown experiments across eight event types. The strip on the left-hand side of the plot groups RBPs by their previously reported primary functions [11]. For each RBP, the adjacent bar on the right-hand side displays the total number of differential ATR events across all types

