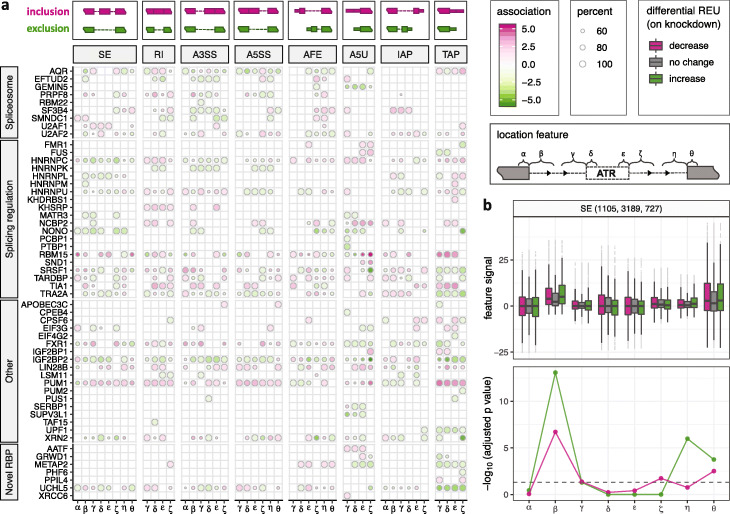
Fig. 4.
Global positioning associations with differential ATR. a SURF-identified associations (analysis module 2) of location features with differential ATR across 54 RBPs. Each row depicts a single RBP, and each column represents one location feature, grouped by the corresponding ATR event types (column strips). Each circle symbol in individual cells indicates a significant association at FDR of 0.05. The color of the circles represents inclusion (pink) or exclusion (green), and the fill-in densities are determined by − log10-transformed adjusted p values from the association testing. For features with dual functions (i.e., binding of RBPs at these features associate with both inclusion and exclusion), the circle size indicates the percentage of − log10-transformed adjusted p value for the stronger one relative to the sum of both (i.e., smaller circles indicate similar associations). Illustrations above the column strips of event types depict the notions of exclusion and inclusion status of ATR. b Functional association plot of AQR for SE event. Upper panel box plot displays the distributions of feature signals among the three differential ATR groups (decrease, no change, increase). The numbers of SE events in each group are reported in parentheses at the top strip. The lower panel depicts the − log10-transformed p values for each tested association after multiplicity correction. The dashed line indicates the FDR level of 0.05

