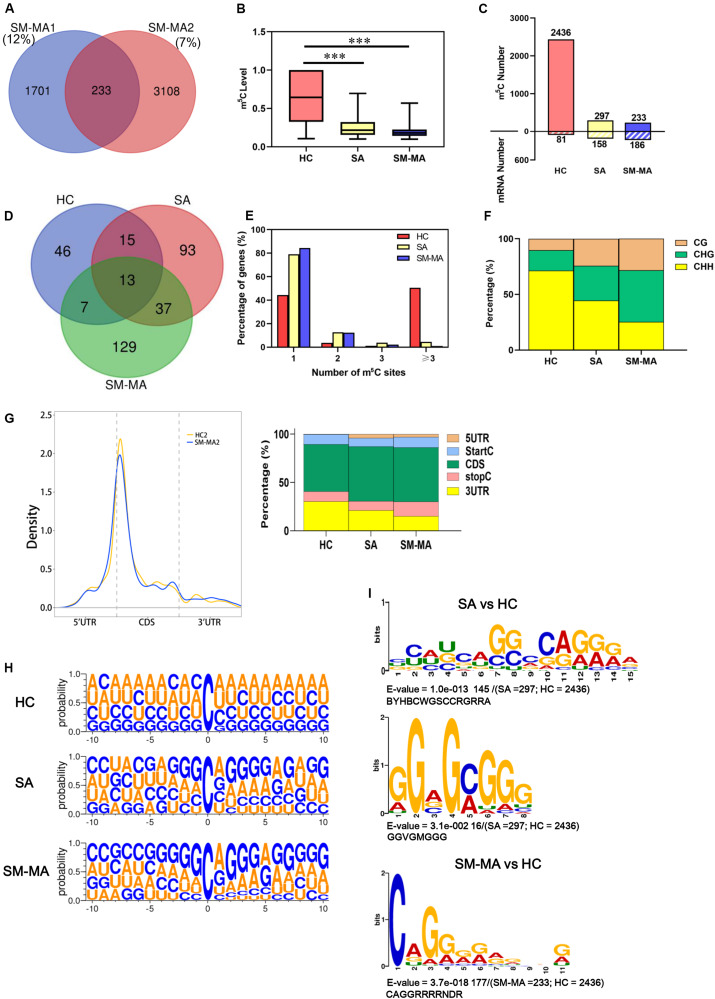
FIGURE 2.
Distribution profiles of m5C in mRNAs from systemic lupus erythematosus CD4+ T cells. (A) Venn diagram showing overlap of m5C sites within mRNAs between two SLE moderate/major active (SM-MA) pool replicates. (B) Bar chart showing level of m5C sites among healthy controls (HCs) and SLE stable (SA) and SLE moderate/major active (SM-MA) patients (***p < 0.001). (C) Bar chart showing number of m5C sites and m5C-containing mRNA among HCs and SA and SM-MA patients. (D) Venn diagram showing overlap of genes within m5C-containing mRNAs in HCs and SA and SM-MA patients. (E) Proportion of genes harboring different numbers of m5C sites in three groups. The majority of genes harboring only one m5C site except that in the HC group. (F) Bar chart showing percentage of mRNA m5C sites identified in each sequence context (CG, CHG, and CHH, where H = A, C, or U) in CD4+ T cells of HCs and SA and SM-MA patients. (G) Distribution of m5C sites along mRNA transcripts. The moving averages of percentages of mRNA m5C sites are shown (raw data; only HC2 and SM-MA2 group are shown here) (left). The averages of percentages of mRNA m5C sites within 5′UTR, StartC, CDS, stopC, and 3′UTR regions in transcriptomes are shown. Distribution of m5C sites peaks along mRNA transcripts are shown (right). (H) Sequence frequency logo for the sequences proximal to mRNA m5C sites among HCs and SLE patients. (I) Top differential enrichment mode motifs (SA vs. HC; SM-MA vs. HC) enriched across the sequences proximal to mRNA m5C sites identified from HCs and SA and SM-MA patients (only E-value < 0.05 was shown here).

