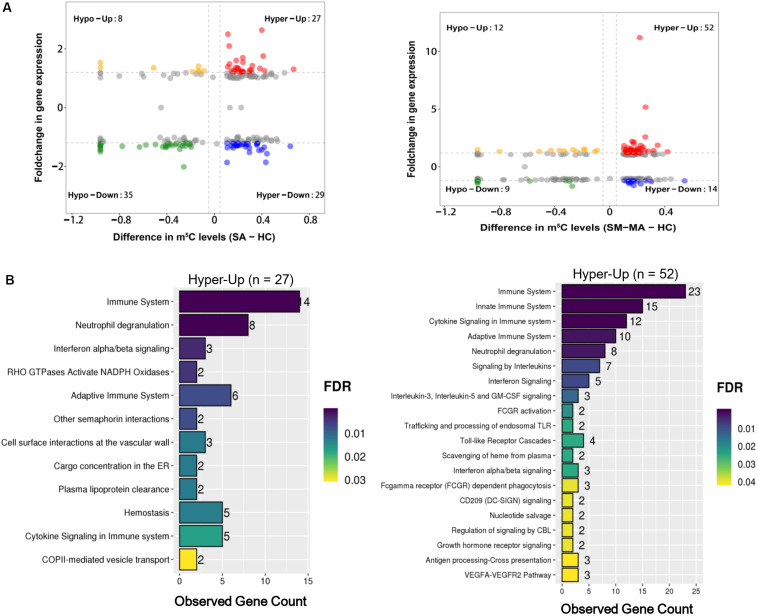
FIGURE 4.
Conjoint analysis of differentially methylated genes and differentially expressed genes. (A) Distribution of mRNAs with a significant change in both m5C modification and gene expression levels in healthy controls (HCs) and SLE stable (SA)/SLE moderate/major active (SM-MA) patients, respectively. (B) Reactome pathways analysis of hypermethylated mRNAs with up-regulated genes in SA versus HC (left) or SM-MA versus HC (right) groups, respectively.

