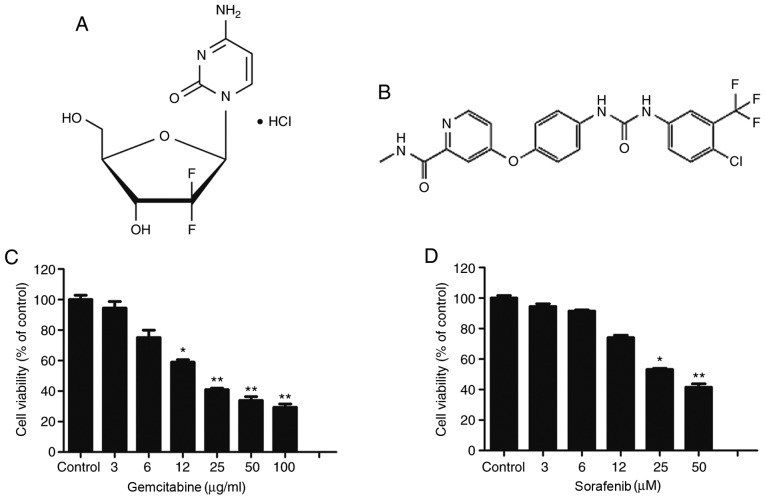
Figure 1.
Dose-dependent cytotoxic effect of gemcitabine and sorafenib on A549 cells. (A and B) The molecular structure of (A) gemcitabine and (B) sorafenib. (C and D) A549 cells were treated with (C) 0–100 µg/ml of gemcitabine and (D) 0–100 µM of sorafenib for 48 h, and cell viability was determined by an MTT assay. *P<0.05 vs. Control, **P<0.01 vs. Control.

