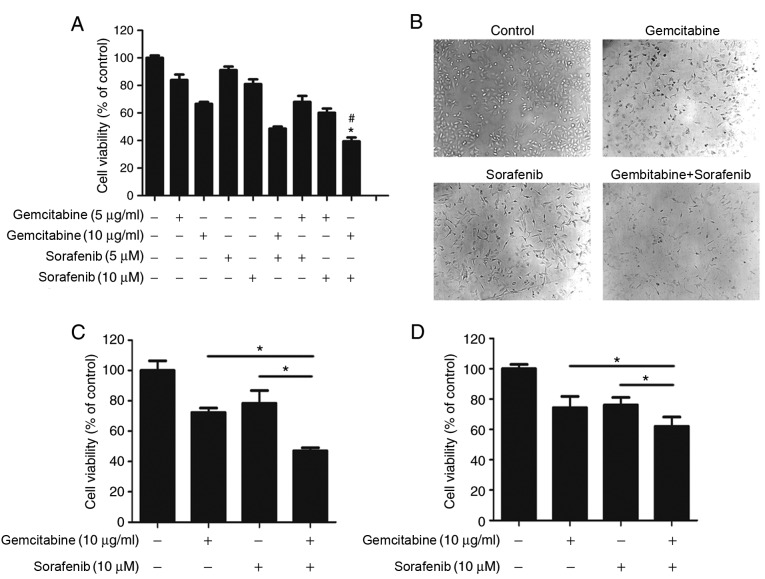
Figure 2.
Synergistic antitumor effects of gemcitabine and sorafenib on A549 cells. (A) A549 cells were treated with 5 or 10 µg/ml gemcitabine and 5 or 10 µM sorafenib, either alone or in combination for 48 h, and cell viability was determined by an MTT assay. (B) A549 cells were treated with a combination of 10 µg/ml gemcitabine and 10 µM sorafenib for 48 h, and cell morphology was subsequently observed using an inverted microscope. (C) H1975 and (D) H1650 cells were treated with 10 µg/ml gemcitabine and 10 µM sorafenib, either alone or in combination for 48 h, and cell viability was determined by an MTT assay. *P<0.05 compared vs. gemcitabine group; #P<0.05 compared vs. sorafenib group.

