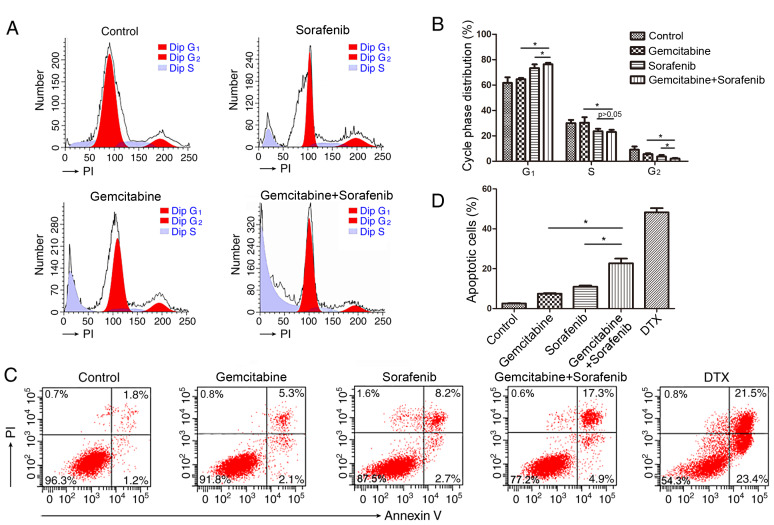
Figure 3.
Co-treatment with gemcitabine and sorafenib induces apoptosis and cell cycle arrest in A549 cells. A549 cells were treated with 10 µg/ml gemcitabine and 10 µM sorafenib, either alone or in combination for 48 h. (A) Cell cycle distribution was determined by flow cytometry analysis. (B) The quantification of cells in different phases of the cell cycle is presented in bar charts. (C) The percentage of apoptotic cells was determined by flow cytometry analysis. PI, propidium iodide. (D) The percentage of A549 cells positive for Annexin V staining was presented in bar charts. *P<0.05.

