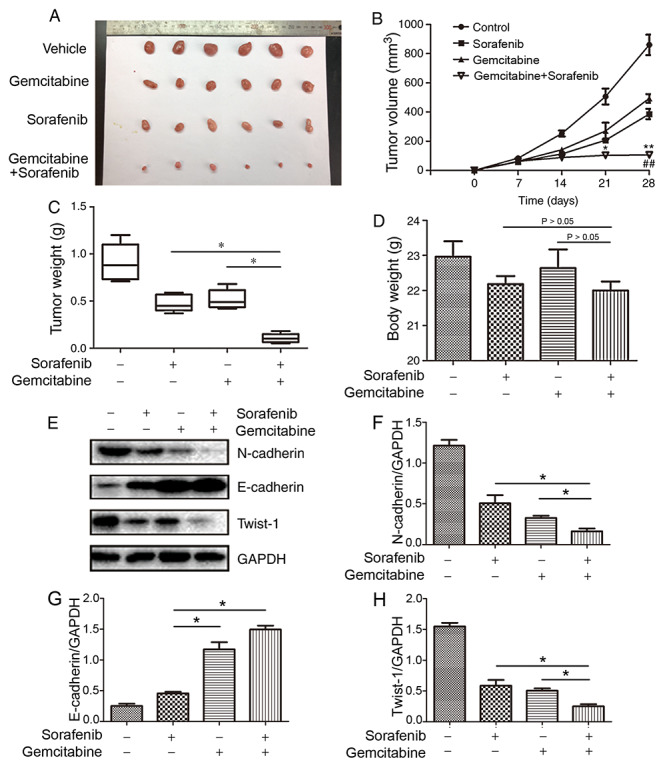
Figure 7.

Synergistic antitumor effect of co-treatment with gemcitabine and sorafenib in non-small cell lung cancer xenograft model. (A) The images of tumor diameters of the different groups. (B) Tumor volume (*P<0.05 compared vs. gemcitabine group; **P<0.01 compared vs. gemcitabine group; ##P<0.01 compared vs. sorafenib group). (C) Tumor weight (*P<0.05) and (D) body weight of the different groups (P>0.05). (E) Protein expression levels of N-cadherin, E-cadherin and Twist-1 in tumor tissues. (F-H) Quantitative analysis of (F) N-cadherin, (G) E-cadherin and (H) Twist-1. *P<0.05.
