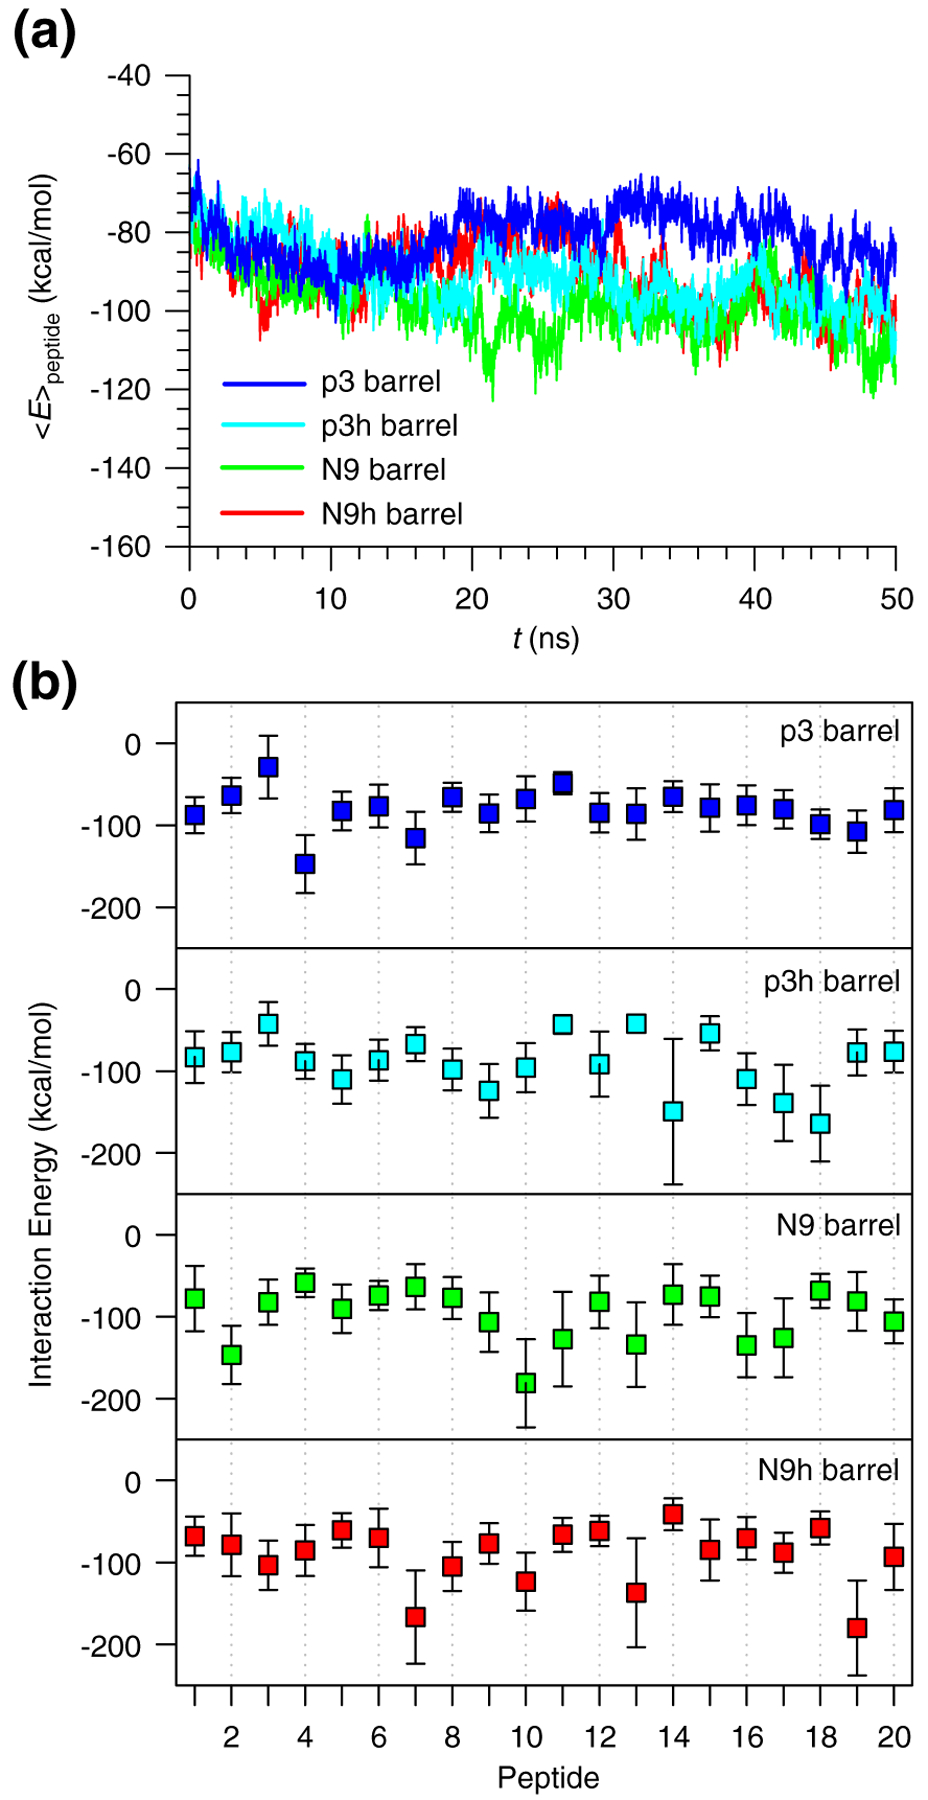
Fig. 2.

Interaction energies of truncated Aβ peptides with lipids. (a) Time series of averaged peptide interaction energy with DOPC lipids for the 20-mer p3 (blue line), p3h (cyan line), N9 (green line), and N9h (red line) barrels. (b) Interaction energies of each monomer in the 20-mer p3 (blue symbols), p3h (cyan symbols), N9 (green symbols), and N9h (red symbols) barrels averaged over time.
