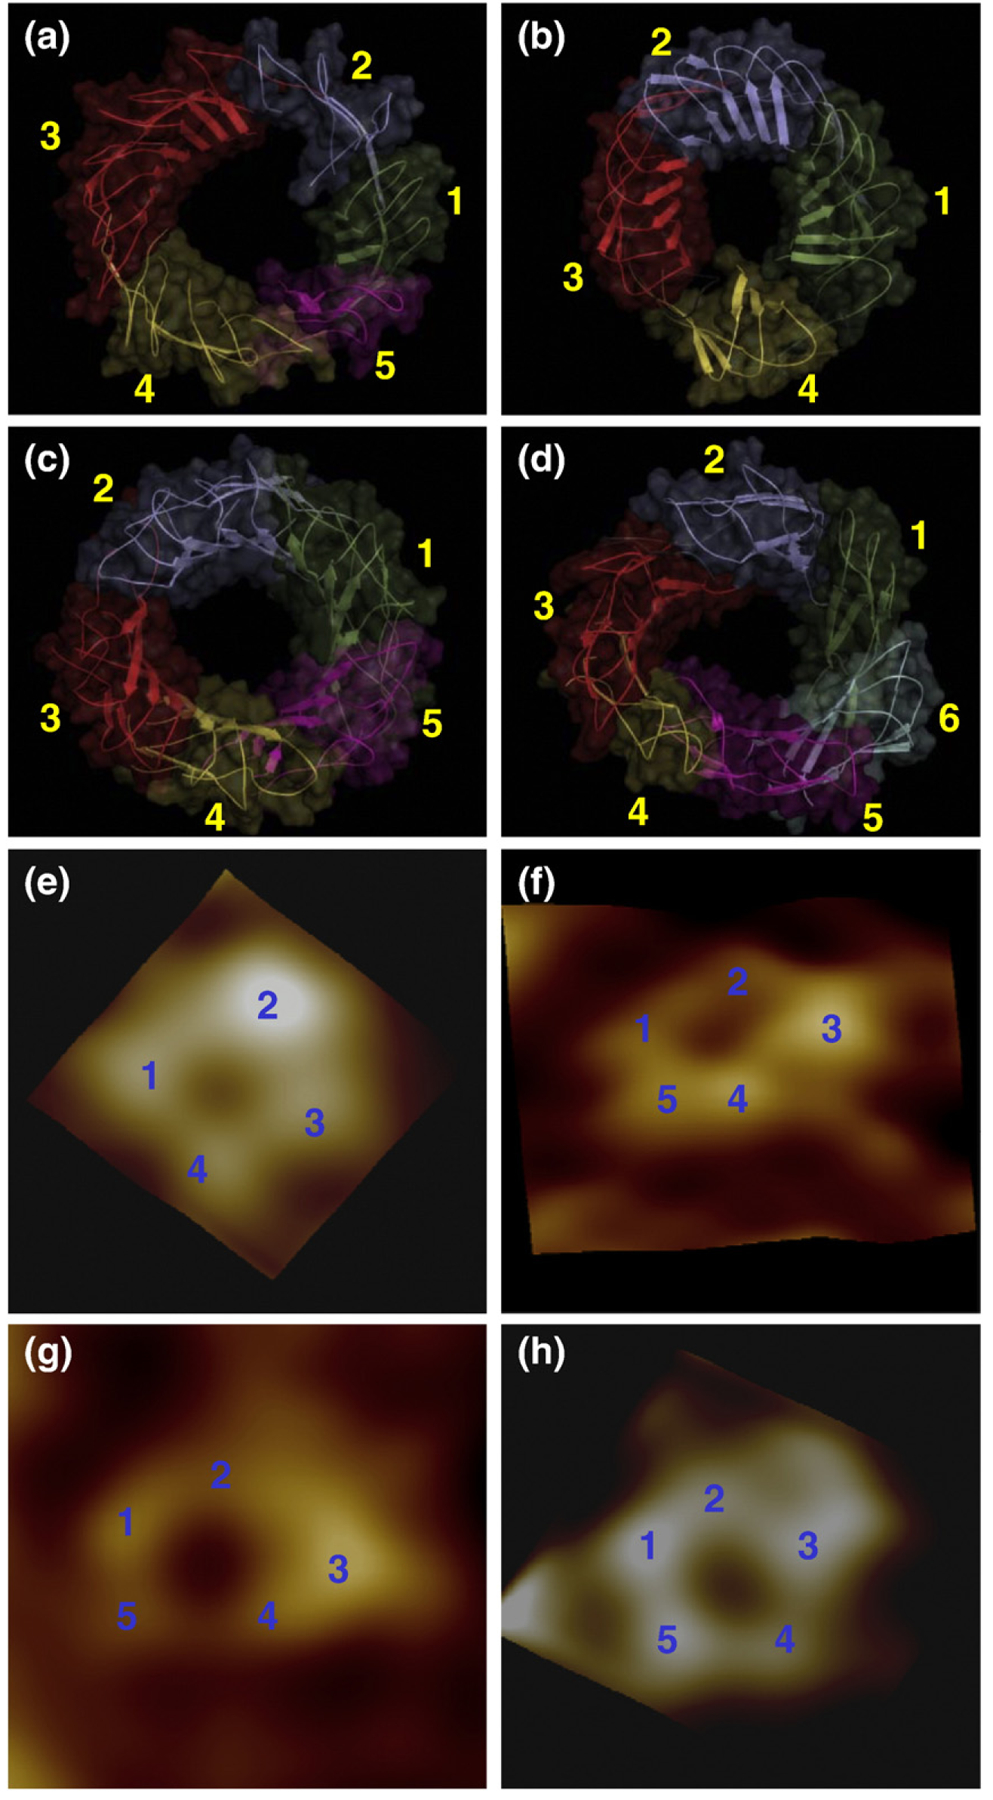
Fig. 6.

Side-by-side comparison between the computational barrels and the experimental channels. The simulated barrel structures with highlighted subunits for the 20-mer p3 (a), p3h (b), N9 (c), and N9h (d) barrels. The averaged barrels in the surface representation are shown in the view along the membrane normal. AFM images of p3 (e and f) and N9 (g and h) barrels show four or five subunits, consistent with the simulated barrels. Image sizes are 15 × 15 and 23×23 nm2, respectively (Jang et al.49; permission was obtained.)
