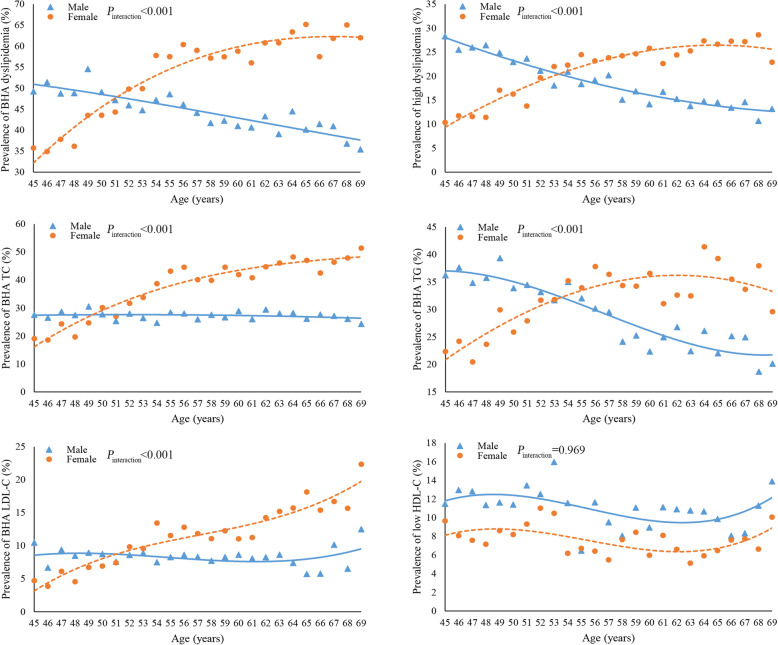
Fig. 1.
The age and gender distribution of dyslipidemia prevalence in 26,378 participants from rural Hua County, China, 2012–2016 a. a Age and gender distribution of borderline high and above (BHA) dyslipidemia. b Age and gender distribution of high dyslipidemia. c Age and gender distribution of BHA total cholesterol (TC). d Age and gender distribution of BHA triglycerides (TG). e Age and gender distribution of BHA low-density lipoprotein cholesterol (LDL-C). f Age and gender distribution of low levels of high-density lipoprotein cholesterol (HDL-C). a A cubic polynomial curve was fitted to reduce random fluctuations. Heterogeneity between genders was tested using models with main effects and interaction terms of gender variable and the linear, quadratic and cubic forms of age variable separately. The P values presented were under the null hypothesis that “the coefficients of all interaction terms equal zero”

