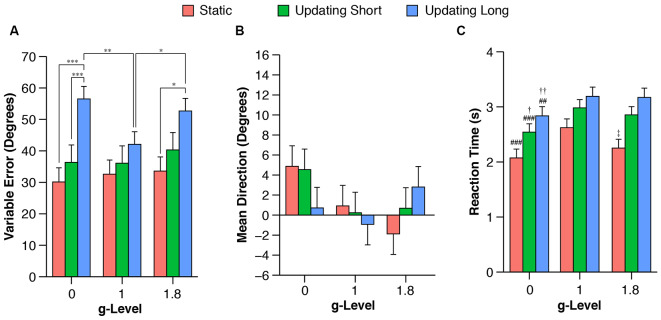
Figure 4.
Mean variable (A) and signed (B) pointing errors, and reaction time (RT; C) during 0 g, 1 g, and 1.8 g and different trial conditions (static, updating short, updating long). Variable pointing error was computed as the standard deviation of the signed pointing errors for each participant and each g-level and task condition using circular statistics. Data are estimated means and standard errors. Note that no contrasts were performed between task conditions for RTs because RTs were a logical consequence of task condition, i.e., the 3D arrow had to be moved a shorter angular distance for static and short updating trials compared to long updating trials (for details see “Behavioral and Statistical Analysis” in “Materials and Methods” section). *P < 0.05. **P < 0.01. ***P < 0.001. ##P < 0.01 for 0 g vs. 1 g. ###P < 0.01 for 0 g vs. 1 g. †P < 0.05 for 0 g vs. 1.8 g. ††P < 0.01 for 0 g vs. 1.8 g. ‡P < 0.05 for 1 g vs. 1.8 g.

