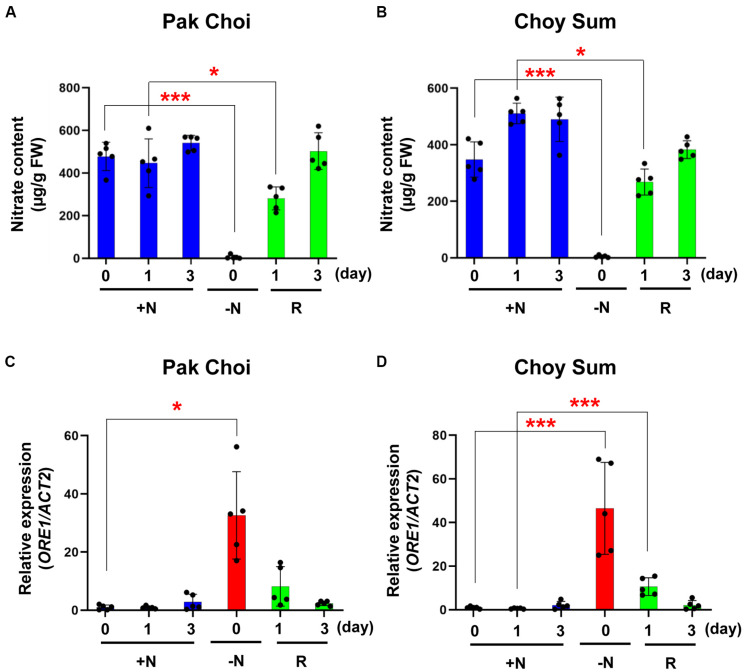
FIGURE 7.
Nitrate content and ORE1 orthologous gene expression levels of two leafy vegetables in recovery experiments. (A,B) Nitrate content of leaf No. 4 was analyzed in +N or recovery plants (R) in Pak Choi (A) and Choy Sum (B). Data are mean values, n = 5 (biologically independent experiments) and individual data points are shown as overlays. Asterisks indicate statistically significant difference compared with +N. *P < 0.05, **P < 0.01, and ***P < 0.001; two-tailed t-test. FW; fresh weight. (C,D) ORE1 orthologous gene transcript levels were analyzed by qRT-PCR in leaf No. 4 samples of +N or recovery plants (R) in Pak Choi (C) and Choy Sum (D). Data are mean values, n = 5 (biologically independent experiments) and individual data points are shown as overlays. Asterisks indicate statistically significant difference compared with +N. *P < 0.05, **P < 0.01, and ***P < 0.001; two-tailed t-test. Supplementary Tables S1, S7 show primer sets and P values, respectively.

