

Abstract
The solubility of warfarin sodium isopropanol solvate (WS·IPA), a widely used anticoagulant, was determined at temperatures ranging from 278.15 to 333.15 K in four pure solvents (acetone, ethanol, IPA, and water), five binary solvent mixtures (IPA + acetone, IPA + ethanol, IPA + water, IPA + heptane, and IPA + hexane), and five ternary solvent mixtures (IPA + acetone + heptane, IPA + acetone + hexane, IPA + ethanol + heptane, IPA + ethanol + hexane, and IPA + water + heptane) using the polythermal method. It was demonstrated that the solubility of WS·IPA increases with increasing temperature in the pure solvents and at constant solvent composition in the solvent mixtures. In addition, the solubility of WS·IPA in IPA increases with increasing content of acetone, ethanol, and water, which act as cosolvents, and decreases with increasing content of heptane and hexane, which act as antisolvents. The experimental solubility data of WS·IPA in pure solvents and binary and ternary solvent mixtures were correlated using the modified Apelblat and λh model equations. The correlated solubility data agree with the experimental data based on the relative deviation and the average relative deviation (ARD %) values. Thus, the correlated and experimentally derived solubility data of WS·IPA provide a pathway to engineer advanced pharmaceutical crystallization processes for WS·IPA.
Graphical Abstract
INTRODUCTION
Warfarin (Figure 1a), an essential medicine1 prone to drug shortages,2–5 is the most commonly prescribed oral anticoagulant (∼80 M prescriptions in 2014)6 for the treatment of thromboembolic complications related to cardiovascular diseases, which are the number one cause of mortality in the United States (>600 000 deaths/year).7 To address manufacturing-related drug shortages that often arise for pharmaceutical compounds, such as warfarin, continuous manufacturing has evolved as an area of recent research interest both in academia and industry.8–11 Consequently, the flow synthesis of warfarin has been developed in recent years.11 This represents the first step toward the development of an end-to-end continuous manufacturing process for warfarin and other pharmaceutical products of high demand.8–11 Integrated continuous manufacturing, a key aspect of process intensification,8,9,12–14 would require the crystallization of warfarin (i) to obtain a pure product and (ii) to produce the crystalline form needed in the solid dosage formulation.15 In spite of the very low aqueous solubility of warfarin alone, its salt, warfarin sodium16 (WS, Figure 1b), shows high solubility in water and is thus grouped in the Biopharmaceutical Classification System as a class 1 compound.17 WS is formulated as a solvate,18–20 also known as clathrate,20–23 in which isopropanol (IPA) is entrapped into the crystalline lattice at a ratio of WS to IPA of 2:1 (Figure 1c).15,18,24 In order to advance in the development of a continuous crystallization process leading to the desired solid form (WS·IPA) for formulation,15,25 solubility of this compound in various solvents and solvent mixtures26,27 needs to be understood.
Figure 1.

Molecular structure of (a) warfarin, (b) WS, and (c) WSIPA.
Upon reviewing the available literature, very limited solubility data for WS·IPA in various solvents have been reported.24,28 The solubility of WS·IPA has not been previously reported in any of the pure solvents or solvent mixtures employed in the present work.29 Moreover, there is no account correlating WS·IPA solubility and solvent composition, which are fundamental parameters needed to engineer an antisolvent cooling crystallization process for this or other compounds.30 The selection of the crystallization solvent also affects nucleation and growth kinetics, crystal morphology, and structure31–34 that in turn influence the physicochemical properties of the active pharmaceutical ingredient and its performance.35,36 Hence, the present study focuses on the determination of the solubility of WS·IPA in four pure solvents (acetone, ethanol, IPA, and water), five binary mixtures (IPA + acetone, IPA + ethanol, IPA + water, IPA + heptane, and IPA + hexane), and five ternary mixtures (IPA + acetone + heptane, IPA + acetone + hexane, IPA + ethanol + heptane, IPA + ethanol + hexane, and IPA + water + heptane) at temperatures ranging from 278.15 to 333.15 K using the polythermal method37 in a Crystal16 multiple reactor system.9,27,30,38–40 The solvents are categorized as class 3 by the Food and Drug Administration (less toxic and lower risks to human health) except hexane, which is a class 2 solvent.41 However, hexane is commonly used as an antisolvent in pharmaceutical crystallization processes.8,9,42 The experimental solubility data were correlated employing the modified Apelblat and λh model equations, which enable the interpolation and extrapolation of the determined solubility, providing a better understanding of the solubility profile for WS·IPA. Collectively, the experimental and correlated solubility data presented in this study pave the way to engineer a continuous antisolvent cooling crystallization process for this compound.
EXPERIMENTAL SECTION
Materials.
Table 1 shows the CAS number, commercial source, purity (determined by chemical supplier), analysis method, and solvent classification of the materials employed in this study. Nanopurified water (18.23 MOhm/cm, pH = 5.29, and mV = 76.8) was utilized as-obtained from a water purification system Aries Filter (Gemini). All materials were used “as-received” without further purification.
Table 1.
Sources and Mass Fraction Purity of Materials with Corresponding Analysis Method
| chemical name | CAS registry number | source | percentage purity (%)a | purification method | analysis method | solvent classification41 |
|---|---|---|---|---|---|---|
| acetone | 67–64-1 | VWR | ≥99.5 | none | GCb | class 3 |
| ethanol | 64–17-5 | Pharmco Aaper | ≥99.9 | none | GCb | class 3 |
| heptane | 142–82-5 | VWR | 99.9 | none | GCb | class 3 |
| hexane | 110–54-3 | VWR | 98.5 | none | GCb | class 2 |
| IPA | 67–63-0 | VWR | 99.5 | none | GCb | class 3 |
| warfarin | 81–81-2 | Ningbo Samreal | 99.25 | none | HPLCc | |
| WS·IPA | 67430–45-9 | Ningbo Samreal | ≥97.0 | none | HPLCc |
Provided by the supplier.
Gas chromatography.
High-performance liquid chromatography.
Solubility Measurements.
Solubility measuring techniques can be grouped into isothermal43–45 and polythermal methods.37,40,46–48 The isothermal method measures the solubility at predetermined temperatures of unknown concentrations by adding excess of crystalline material into the solvent to measure the concentration after an extended period of stirring (often 24 h). The polythermal method determines the solubility at unknown temperatures of solutions with predetermined concentrations at specified heating rates. Consequently, the isothermal method allows for solubility measurements at the same temperature interval,49,50 whereas the polythermal method determines the solubility at different temperature intervals in between the data points of a particular solubility curve. In this study, the solubility of WS·IPA was determined applying the polythermal method37–40,48 by using a Crystal16 multiple reactor system (Technobis Crystallization Systems), leading to unevenly distributed data points within the reported temperature range.9,27,38–40 Sealed glass vials with an internal volume of 2 mL (Fisher Scientific) were employed to prepare the samples with different concentrations using a microbalance (XP26, Mettler Toledo, uncertainty ± 0.002 mg) to weigh the solute and an analytical balance (MS104S, Mettler Toledo, uncertainty ± 0.1 mg) to weigh the pure solvents and solvent mixtures. The resulting suspensions were vigorously agitated using a magnetic stir bar (rare earth) at 700 rpm while being heated from 278.15 to 333.15 K at 0.3 K/min.40,51,52 Owing to the boiling point restriction of acetone (329.15 K),53 the temperature range needed to be adjusted to 278.15−323.15 K for the pure solvent and all solvent mixtures containing this solvent. Assuming that the dissolution kinetics can be neglected,39 the transmission of light through the suspension can be used to determine the saturation temperature at its maximum using the software CrystalClear (v 1.0.1.614).9,27,38–40,48,54 Each concentration was measured at least twice to ensure accuracy.59 The uncertainty of each saturated temperature was within ±0.1 K. The mole fraction solubility (xi) of WS·IPA was calculated using eq 1
| (1) |
where mi and Mi represent the mass (g) and molecular weight (g/mol) of WS·IPA (MW = 360.36 g/mol)18,21,24 and the solvents employed, respectively.
The isothermal method was performed to validate the reliability of the polythermal method in providing accurate molar solubility measurements for the systems presented within this work for which the polythermal method was employed. Isothermal measurements were performed as follows: an excess of WS·IPA (1) was added to 1.5 mL of the binary solvent system IPA (2) + ethanol (3) with a mass fraction of ethanol, w3 = 0.304 in sealed glass vials with an internal volume of 2 mL (Fisher Scientific). The excess amount (∼10 mg above solubility) was calculated for each selected temperature based on the solubility of WS·IPA (1) previously determined by the polythermal method. The samples were kept at the following selected temperatures, 293.15, 303.15, 313.15, and 323.15 K in a Crystal16 multiple reactor system (Technobis Crystallization Systems) for 24 h. The resulting suspensions were vigorously agitated using a magnetic stir bar (rare earth) at 700 rpm for 20 h and left to settle for 4 h without stirring. Approximately 1 mL of the clear supernatant of each sample was filtered through a 0.2 μm syringe filter (PTFE, 25 mm, Fischer Scientific) and diluted with the binary IPA + ethanol (w3 = 0.304) solvent mixture to a target concentration for absorbance measurement using UV−vis spectroscopy. The λmax of absorption for WS·IPA in the binary solvent mixture occurs at 305 nm. A linear calibration curve (R2 = 0.9997) was obtained by measuring serial dilutions of WS·IPA in the binary solvent mixture (IPA + ethanol with w3 = 0.304).
Raman Spectroscopy.
Raman spectra were recorded at room temperature using a Thermo Scientific DXR2 Raman microscope equipped with 532 nm laser, 400 lines/mm grating, and a 25 μm slit. The spectra were collected over the range of 600−3400 cm−1, averaging 20 scans with 10 s exposure time per scan. The spectra obtained were analyzed using the OMNIC for Dispersive Raman software (version 9.2.0). Before the solubility measurements, the commercial sample was analyzed by Raman microscopy and the solid-state was confirmed as the WS·IPA solvate (Supporting Information).57 The resulting suspensions were measured by Raman microscopy after the experiments were completed to confirm that the yielded material was WS IPA (Supporting Information). For the ternary solvent system IPA + acetone + hexane, a solid material could only be recovered for the hexane mass fractions (w4) of 0.086 and 0.174.
Powder X-ray Diffraction.
Powder X-ray diffractograms were collected for all samples using a Rigaku XtaLAB SuperNova single microfocus Cu Kα radiation (λ = 1.5417 Å) source equipped with a HyPix3000 X-ray detector in the transmission mode, operating at 50 kV and 1 mA (Supporting Information). Powder diffractograms were collected at 300 K over an angular 2θ range between 7 and 40° with a step of 0.01° using the Gandolfi move experiment for powders (90 s exposures). Before the solubility measurements, the commercial sample was analyzed by Powder X-ray diffraction (PXRD) and the solid-state was confirmed as the WS·IPA solvate (Supporting Information).19 The resulting suspensions were measured by PXRD after the experiments were completed to confirm that the yielded material was WS·IPA (Supporting Information). For the ternary solvent system IPA + acetone + hexane, a solid material could only be recovered for the hexane mass fractions (w4) of 0.086 and 0.174.
Differential Scanning Calorimetry.
The melting temperature, Tm, and enthalpy of fusion, ΔfusH, of WS were determined in a differential scanning calorimetry (DSC) Q2000 (TA Instruments Inc.) equipped with a RCS40 single-stage refrigeration system. The calibration of the instrument was made with an indium standard (Tm = 429.75 K and ΔfusH = 28.54 J/g). Samples (∼2.200 mg) were weighed using a microbalance (XP26, Mettler Toledo, uncertainty ± 0.002 mg) and placed on hermetically sealed pans with a pinhole, which is the preferred method when studying solvates.58–61 The samples were equilibrated at 298.15 K for 10 min before heating to 523.15 K under a N2 atmosphere (50 mL/min) at a rate of 5.0 K/min and a temperature accuracy of 0.1 K. The thermograms were analyzed using the software, TA Universal Analysis 2000 (version 4.5A). The measurements were conducted five times (n = 5), and the average result of the peak temperatures was taken to ensure accuracy (Supporting Information). The standard uncertainty, u, for the experimental temperature measured with DSC was estimated to be u(Tm) = 0.5 K.
Thermogravimetric Analysis.
The desolvation and degradation of WS·IPA was recorded in a thermogravimetric analysis (TGA) Q500 (TA Instruments Inc.) calibrated with calcium oxalate monohydrate. Samples (5−10 mg) were equilibrated at 298.15 K for 10 min before heating to 523.15 K under a N2 atmosphere (60 mL/min) at a rate of 5.0 K/min and a temperature accuracy of 0.1 K. The data were analyzed with TA Universal Analysis software v 4.5A.
THERMODYNAMIC MODELS
To facilitate a broader understanding of the solution behavior of WS·IPA in the various solvents and solvent mixtures, the experimental solubility of WS·IPA in pure solvents and binary and ternary solvent mixtures was correlated by using the modified Apelblat and λh model equations. The modeling allows for a more general quantification of the solubility profile of WS· IPA and enables the interpolation of solubility data.
Modified Apelblat Equation.
The modified Apelblat eq 2 is a commonly used semiempirical model that correlates the solubility of a solute as a function of the absolute temperature40,48,54–56
| (2) |
In eq 2, x1 represents the mole fraction solubility of WS·IPA, T is the absolute temperature in kelvin (K), and A, B, and C are empirical model parameters. The values of A and B depict the variation in the solution activity coefficient, and C reflects the effect of temperature on the fusion enthalpy.48,62
λh Equation.
The λh equation, eq 3, was proposed by Buchowski et al.63 to correlate solubility and temperature of solid−liquid equilibrium systems.40,48,54–56
| (3) |
In eq 3, x1 represents the mole fraction solubility of WS·IPA, T and Tm are the experimental and normal melting temperatures of WS in kelvin (K), respectively, whereas λ and h are parameters that model the nonideal properties of the solution system and the excess mixture enthalpy of solution, respectively.
Origin (OriginLab Corporation, version B95.0.193) was used to model the modified Apelblat and λh model equations using the Levenberg−Marquardt algorithm to solve the nonlinear curve-fitting problem. The relative deviation (RD) and average relative deviation (ARD %) were determined using eqs 4 and 5, respectively, to evaluate the correlation between the experimental and calculated solubility data.
| (4) |
| (5) |
In eqs 4 and 5, and are the ith experimental and correlated mole fraction solubility, respectively, and N is the total number of experimental values.
RESULTS AND DISCUSSION
Validation of Experimental Technique.
To confirm the accuracy of the results obtained employing the polythermal method, the solubility of WS·IPA (1) was measured in a binary solvent system composed of IPA (2) + ethanol (3) with w3 = 0.304, using the isothermal method. The molar solubilities determined at 293.15, 303.15, 313.15, and 323.15 K were used as reference to calculate the ARD % of the solubility data determined by the polythermal method. For comparison, the data for the polythermal method were derived by calculating the respective concentrations at the target temperatures using the modified Apelblat and λh model equations with the optimized parameter values for the WS·IPA (1) + IPA (2) + ethanol (3) with w3 = 0.304 system determined within this work. The solubility data for the isothermal and polythermal methods are listed in Table 2 and graphically compared in Figure 2. It can be observed that the isothermal and polythermal data are closely correlated. Moreover, the low ARD % values of 4.30 and 4.27 for the isothermal method with respect to the polythermal method derived from the modified Apelblat and the λh model equations, respectively, prove the reliability of the polythermal method in providing accurate molar solubility measurements for the systems presented within this work.
Table 2.
Solubility of WS·IPA (x1) in Binary Solvent Mixture of IPA (2) + Ethanol (3) with w3 = 0.304 at Different Temperatures, T, and at Pressure, p = 101.3 kPaa
| T/K | 103 | 103 xA | 103 xλ |
|---|---|---|---|
| 293.2 | 5.15 | 5.56 | 5.57 |
| 303.2 | 7.27 | 7.06 | 7.06 |
| 313.2 | 8.19 | 8.87 | 8.86 |
| 323.2 | 10.48 | 11.04 | 11.03 |
| ARD % | 4.30 | 4.27 |
Standard uncertainty, u, is u(T) = 2 K. Relative standard uncertainties, ur are ur(p) = 0.1, ur(x1) = 0.01, and ur(w3) = 0.001. refers to the experimental mole fraction solubility measured with the isothermal method. xA and xλ represent the derived solubility using the modified Apelblat and the λh model equation, respectively, with the optimized parameter values for the WS·IPA (1) + IPA (2) + ethanol (3) with w3 = 0.304 system determined within this work. w3 is the mass fraction of ethanol (3) in a binary IPA (2) + ethanol (3) mixture.
Figure 2.

Comparison between experimental solubility data (isothermal method) of WS·IPA (1) in the binary solvent system IPA (2) + ethanol (3) with w3 = 0.304 determined by employing the isothermal method (□) with that of the polythermal method derived using the modified Apelblat (△) and the λh (◊) model equation, respectively, with the optimized parameter values determined within this work.
DSC & TGA Results.
The peak melting temperature (Tm) for WS was reported previously by Gao and Maurin28 (460.15 K) using an open pan but was redetermined experimentally within this study using hermetically sealed pans with a pinhole, which is the preferred method when studying solvates.58–61 It could be confirmed that WS·IPA loses its IPA content (∼8%) at ∼393.15 K28 without further chemical degradation before the melting of the desolvated form, WS (Supporting Information). The average peak value of Tm = 468.87 K obtained in this study was used to calculate the correlated mole fraction solubility () employing the λh model equation.
Solubility Data.
The experimentally measured mole fraction solubility data of WS·IPA in the pure solvents and solvent mixtures as well as the RD between the experimental and correlated solubility are presented in Tables 3–13. The mole fraction solubility of WS·IPA in the four pure solvents (acetone, ethanol, IPA, and water) is listed in Table 3, whereas the mole fraction solubility data for the binary solvent systems (IPA + acetone, IPA + ethanol, IPA + water, IPA + heptane, and IPA + hexane) and ternary mixtures (IPA + acetone + heptane, IPA + acetone + hexane, IPA + ethanol + heptane, IPA + ethanol + hexane, and IPA + water + heptane) are shown in Tables 4–8 and Tables 9–13, respectively.
Table 3.
Experimental and Correlated Mole Fraction Solubility of WS·IPA (x1) in Pure Solvents Acetone, Ethanol, IPA, and Water at Different Temperatures, T, and at Pressure, p = 101.3 kPaa
| Apelblat |
λh |
Apelblat |
λh |
||||||||
|---|---|---|---|---|---|---|---|---|---|---|---|
| T/K | 103 | 103 | 102 RD | 103 | 102 RD | T/K | 103 | 103 | 102 RD | 103 | 102 RD |
| acetone | ethanol | ||||||||||
| 278.9 | 5.77 | 5.93 | −2.72 | 6.05 | −4.85 | 278.8 | 23.99 | 24.38 | −1.62 | 23.75 | 1.00 |
| 283.6 | 7.31 | 7.08 | 3.06 | 7.16 | 1.98 | 284.9 | 27.27 | 26.88 | 1.43 | 26.66 | 2.23 |
| 297.8 | 11.28 | 11.61 | −2.97 | 11.56 | −2.47 | 293.4 | 31.00 | 30.91 | 0.28 | 31.16 | −0.50 |
| 304.0 | 14.35 | 14.15 | 1.35 | 14.06 | 1.98 | 306.4 | 38.76 | 38.61 | 0.39 | 39.18 | −1.09 |
| 307.4 | 16.10 | 15.71 | 2.42 | 15.61 | 3.00 | 312.3 | 42.76 | 42.81 | −0.13 | 43.34 | −1.35 |
| 315.3 | 19.25 | 19.78 | −2.79 | 19.76 | −2.65 | 321.3 | 49.69 | 50.27 | −1.16 | 50.39 | −1.41 |
| 320.8 | 23.25 | 23.03 | 0.93 | 23.15 | 0.45 | 324.6 | 53.53 | 53.35 | 0.33 | 53.21 | 0.59 |
| 328.6 | 57.58 | 57.37 | 0.38 | 56.82 | 1.33 | ||||||
| IPA | water | ||||||||||
| 280.5 | 0.63 | 0.67 | −6.14 | 0.62 | 0.75 | 282.4 | 1.33 | 1.22 | 8.64 | 2.57 | −93.12 |
| 283.7 | 0.76 | 0.73 | 4.05 | 0.70 | 8.24 | 288.1 | 2.26 | 2.35 | −4.04 | 3.85 | −70.47 |
| 302.2 | 1.32 | 1.29 | 2.32 | 1.32 | 0.09 | 303.2 | 7.39 | 9.68 | −31.00 | 10.37 | −40.34 |
| 312.9 | 1.79 | 1.80 | −0.54 | 1.84 | −2.60 | 317.9 | 25.59 | 25.99 | −1.56 | 24.69 | 3.53 |
| 315.6 | 1.94 | 1.97 | −1.23 | 2.00 | −2.85 | 320.2 | 32.08 | 29.42 | 8.29 | 28.04 | 12.56 |
| 326.4 | 2.80 | 2.79 | 0.36 | 2.74 | 1.93 | 329.8 | 44.53 | 45.53 | −2.25 | 46.59 | −4.65 |
Standard uncertainty, u, is u(T) = 2 K. Relative standard uncertainties, ur are ur(p) = 0.1, ur(x1) = 0.01. refers to the experimental mole fraction solubility. refers to the calculated solubility data using the Apelblat and λh model equations. RD represents the corresponding relative deviation.
Table 13.
Experimental and Correlated Mole Fraction Solubility of WS·IPA (x1) in the Ternary Solvent Mixture of IPA (2) + Water (3) with w3 = 0.013 + Heptane (4) at Different Temperatures, T, and at Pressure, p = 101.3 kPaa
| Apelblat |
λh |
Apelblat |
λh |
||||||||
|---|---|---|---|---|---|---|---|---|---|---|---|
| T/K | 103 | 103 | 102 RD | 103 | 102 RD | T/K | 103 | 103 | 102 RD | 103 | 102 RD |
| w4 = 0.087 | w4 = 0.178 | ||||||||||
| 282.2 | 1.35 | 1.41 | −5.09 | 1.45 | −7.66 | 278.3 | 1.09 | 1.11 | −1.34 | 1.11 | −1.22 |
| 286.1 | 1.61 | 1.62 | −0.37 | 1.64 | −1.89 | 280.8 | 1.21 | 1.20 | 0.43 | 1.20 | 0.48 |
| 295.2 | 2.26 | 2.19 | 3.52 | 2.18 | 3.61 | 295.3 | 1.88 | 1.88 | 0.43 | 1.88 | 0.35 |
| 301.7 | 2.71 | 2.67 | 1.57 | 2.65 | 2.33 | 302.4 | 2.32 | 2.30 | 0.75 | 2.31 | 0.71 |
| 312.5 | 3.61 | 3.64 | −0.85 | 3.60 | 0.24 | 315.2 | 3.25 | 3.28 | −0.88 | 3.28 | −0.85 |
| 323.4 | 4.79 | 4.86 | −1.44 | 4.84 | −1.06 | 324.2 | 4.17 | 4.15 | 0.28 | 4.15 | 0.28 |
| 330.2 | 5.80 | 5.75 | 0.80 | 5.79 | 0.20 | ||||||
| w4 = 0.275 | w4 = 0.386 | ||||||||||
| 281.2 | 1.01 | 1.03 | −1.18 | 0.99 | 1.97 | 281.2 | 0.65 | 0.67 | −3.76 | 0.68 | −5.32 |
| 289.2 | 1.26 | 1.24 | 1.69 | 1.24 | 2.15 | 288.8 | 0.84 | 0.83 | 0.38 | 0.84 | −0.05 |
| 309.7 | 2.04 | 2.06 | −0.81 | 2.09 | −2.47 | 296.4 | 1.05 | 1.02 | 3.18 | 1.02 | 3.46 |
| 317.9 | 2.51 | 2.52 | −0.61 | 2.55 | −1.59 | 307.1 | 1.35 | 1.33 | 1.01 | 1.33 | 1.71 |
| 323.9 | 2.97 | 2.93 | 1.40 | 2.93 | 1.34 | 315.1 | 1.59 | 1.61 | −1.52 | 1.60 | −0.97 |
| 328.9 | 3.30 | 3.32 | −0.58 | 3.29 | 0.34 | 322.9 | 1.88 | 1.92 | −2.21 | 1.92 | −2.22 |
| 326.7 | 2.12 | 2.08 | 1.81 | 2.09 | 1.37 | ||||||
| w4 = 0.473 | |||||||||||
| 285.1 | 0.58 | 0.58 | 0.40 | 0.58 | 0.64 | ||||||
| 301.2 | 0.83 | 0.84 | −0.84 | 0.84 | −0.94 | ||||||
| 308.2 | 0.98 | 0.98 | −0.03 | 0.98 | −0.11 | ||||||
| 314.8 | 1.14 | 1.13 | 0.92 | 1.13 | 0.89 | ||||||
| 320.6 | 1.27 | 1.27 | −0.44 | 1.27 | −0.42 | ||||||
| 326.2 | 1.43 | 1.43 | 0.00 | 1.43 | 0.04 | ||||||
Standard uncertainty, u, is u(T) = 2 K. Relative standard uncertainties, ur are ur(p) = 0.1, ur(x1) = 0.01, ur(w3) = 0.001, and ur(w4) = 0.003. refers to the experimental mole fraction solubility. refers to the calculated solubility data using the Apelblat and λh model equations. RD represents the corresponding relative deviation. w3 is the mass fraction of water (3) in binary IPA (2) + water (3) mixture. w4 is the mass fraction of heptane (4) in ternary IPA (2) + water (3) + heptane (4) mixture.
Table 4.
Experimental and Correlated Mole Fraction Solubility of WS·IPA (x1) in the Binary Solvent Mixture of IPA (2) + Acetone (3) at Different Temperatures, T, and at Pressure, p = 101.3 kPaa
| Apelblat |
λh |
Apelblat |
λh |
||||||||
|---|---|---|---|---|---|---|---|---|---|---|---|
| T/K | 103 | 103 | 102 RD | 103 | 102 RD | T/K | 103 | 103 | 102 RD | 103 | 102 RD |
| w3 = 0.047 | w3 = 0.111 | ||||||||||
| 280.3 | 1.36 | 1.39 | −2.70 | 1.32 | 2.33 | 281.2 | 1.99 | 2.04 | −2.68 | 2.01 | −1.05 |
| 287.1 | 1.53 | 1.56 | −1.95 | 1.55 | −1.06 | 283.3 | 2.14 | 2.15 | −0.82 | 2.13 | 0.21 |
| 290.8 | 1.73 | 1.67 | 3.10 | 1.68 | 2.46 | 294.0 | 2.95 | 2.81 | 4.50 | 2.84 | 3.66 |
| 296.6 | 1.97 | 1.87 | 4.97 | 1.92 | 2.93 | 306.3 | 3.79 | 3.82 | −0.97 | 3.87 | −2.21 |
| 304.9 | 2.17 | 2.23 | −2.99 | 2.29 | −5.52 | 318.0 | 5.02 | 5.11 | −1.97 | 5.12 | −2.14 |
| 312.5 | 2.60 | 2.66 | −2.18 | 2.68 | −3.25 | 322.7 | 5.82 | 5.75 | 1.26 | 5.71 | 1.81 |
| 320.4 | 3.25 | 3.21 | 1.14 | 3.15 | 2.95 | ||||||
| w3 = 0.148 | |||||||||||
| 283.6 | 2.97 | 3.15 | −6.10 | 3.16 | −6.47 | ||||||
| 290.2 | 3.85 | 3.65 | 5.26 | 3.65 | 5.18 | ||||||
| 296.2 | 4.25 | 4.16 | 2.09 | 4.15 | 2.19 | ||||||
| 307.3 | 5.14 | 5.24 | −1.83 | 5.22 | −1.59 | ||||||
| 314.1 | 5.94 | 6.00 | −1.05 | 5.99 | −0.89 | ||||||
| 320.5 | 6.75 | 6.79 | −0.65 | 6.79 | −0.69 | ||||||
| 322.8 | 7.18 | 7.09 | 1.23 | 7.10 | 1.08 | ||||||
Standard uncertainty, u, is u(T) = 2 K. Relative standard uncertainties, ur are ur(p) = 0.1, ur(x1) = 0.01, and ur(w3) = 0.001. refers to the experimental mole fraction solubility. refers to the calculated solubility data using the Apelblat and λh model equations. RD represents the corresponding relative deviation. w3 is the mass fraction of acetone (3) in a binary IPA (2) + acetone (3) mixture.
Table 8.
Experimental and Correlated Mole Fraction Solubility of WS·IPA (x1) in the Binary Solvent Mixture of IPA (2) + Hexane (3) at Different Temperatures, T, and at Pressure, p = 101.3 kPaa
| Apelblat |
λh |
Apelblat |
λh |
||||||||
|---|---|---|---|---|---|---|---|---|---|---|---|
| T/K | 103 | 103 | 102 RD | 103 | 102 RD | T/K | 103 | 103 | 102 RD | 103 | 102 RD |
| w3 = 0.085 | w3 = 0.172 | ||||||||||
| 281.0 | 0.56 | 0.56 | −0.49 | 0.56 | −0.72 | 283.7 | 0.49 | 0.50 | −2.32 | 0.51 | −4.58 |
| 282.9 | 0.64 | 0.60 | 5.85 | 0.61 | 5.66 | 289.5 | 0.62 | 0.61 | 0.81 | 0.62 | 0.07 |
| 291.8 | 0.81 | 0.83 | −2.25 | 0.83 | −2.28 | 293.7 | 0.70 | 0.71 | −1.81 | 0.71 | −1.76 |
| 295.3 | 0.91 | 0.94 | −3.23 | 0.94 | −3.19 | 301.5 | 0.95 | 0.91 | 3.54 | 0.91 | 4.49 |
| 307.5 | 1.38 | 1.39 | −1.11 | 1.39 | −0.96 | 317.4 | 1.44 | 1.46 | −1.44 | 1.45 | −0.61 |
| 315.4 | 1.84 | 1.78 | 3.01 | 1.78 | 3.10 | 322.8 | 1.68 | 1.69 | −0.57 | 1.69 | −0.43 |
| 322.5 | 2.17 | 2.20 | −1.17 | 2.20 | −1.26 | 327.0 | 1.89 | 1.88 | 0.77 | 1.89 | 0.17 |
| w3 = 0.267 | w3 = 0.361 | ||||||||||
| 279.6 | 0.31 | 0.34 | −10.89 | 0.33 | −7.31 | 280.7 | 0.30 | 0.31 | −0.65 | 0.29 | 3.17 |
| 282.6 | 0.36 | 0.37 | −2.89 | 0.37 | −0.57 | 289.9 | 0.38 | 0.39 | −3.47 | 0.39 | −2.45 |
| 291.0 | 0.52 | 0.49 | 4.80 | 0.49 | 4.98 | 298.1 | 0.51 | 0.49 | 4.69 | 0.49 | 4.20 |
| 296.6 | 0.62 | 0.59 | 5.49 | 0.59 | 4.84 | 309.7 | 0.66 | 0.67 | −1.61 | 0.68 | −2.88 |
| 313.2 | 1.00 | 0.99 | 0.57 | 1.00 | −0.70 | 314.9 | 0.77 | 0.77 | 0.86 | 0.77 | −0.25 |
| 321.3 | 1.24 | 1.27 | −2.44 | 1.28 | −3.17 | 327.1 | 1.04 | 1.06 | −1.70 | 1.06 | −1.68 |
| 327.4 | 1.50 | 1.52 | −1.20 | 1.52 | −1.21 | 331.3 | 1.19 | 1.18 | 1.04 | 1.17 | 1.64 |
| 332.0 | 1.77 | 1.74 | 1.40 | 1.73 | 2.03 | ||||||
| w3 = 0.456 | |||||||||||
| 279.5 | 0.27 | 0.27 | 0.78 | 0.25 | 6.40 | ||||||
| 290.0 | 0.32 | 0.33 | −3.75 | 0.33 | −3.61 | ||||||
| 298.0 | 0.40 | 0.39 | 2.90 | 0.39 | 0.85 | ||||||
| 309.0 | 0.49 | 0.49 | 0.87 | 0.50 | −1.77 | ||||||
| 321.5 | 0.64 | 0.65 | −2.30 | 0.66 | −2.63 | ||||||
| 326.5 | 0.75 | 0.74 | 1.16 | 0.73 | 2.47 | ||||||
Standard uncertainty, u, is u(T) = 2 K. Relative standard uncertainties, ur are ur(p) = 0.1, ur(x1) = 0.01, and ur(w3) = 0.001. refers to the experimental mole fraction solubility. refers to the calculated solubility data using the Apelblat and λh model equations. RD represents the corresponding relative deviation. w3 is the mass fraction of hexane (3) in a binary IPA (2) + hexane (3) mixture.
Table 9.
Experimental and Correlated Mole Fraction Solubility of WS·IPA (x1) in the Ternary Solvent Mixture of IPA (2) + Acetone (3) with w3 = 0.095 + Heptane (4) at Different Temperatures, T, and at Pressure, p = 101.3 kPaa
| Apelblat |
λh |
Apelblat |
λh |
||||||||
|---|---|---|---|---|---|---|---|---|---|---|---|
| T/K | 103 | 103 | 102 RD | 103 | 102 RD | T/K | 103 | 103 | 102 RD | 103 | 102 RD |
| w4 = 0.088 | w4 = 0.179 | ||||||||||
| 281.1 | 1.43 | 1.44 | −0.85 | 1.46 | −1.95 | 282.3 | 1.10 | 1.12 | −1.63 | 1.15 | −4.17 |
| 284.5 | 1.61 | 1.58 | 1.62 | 1.59 | 1.01 | 284.7 | 1.21 | 1.20 | 0.35 | 1.22 | −1.24 |
| 289.4 | 1.79 | 1.80 | −0.49 | 1.80 | −0.55 | 290.5 | 1.44 | 1.41 | 1.73 | 1.41 | 1.82 |
| 299.3 | 2.29 | 2.31 | −0.81 | 2.30 | −0.23 | 297.0 | 1.67 | 1.67 | 0.22 | 1.65 | 1.43 |
| 306.0 | 2.72 | 2.71 | 0.46 | 2.69 | 1.10 | 302.9 | 1.90 | 1.92 | −1.08 | 1.89 | 0.49 |
| 313.2 | 3.19 | 3.18 | 0.12 | 3.17 | 0.48 | 312.5 | 2.38 | 2.38 | 0.20 | 2.35 | 1.05 |
| 322.2 | 3.85 | 3.85 | −0.08 | 3.87 | −0.56 | 321.1 | 2.82 | 2.82 | 0.03 | 2.85 | −1.02 |
| w4 = 0.274 | w4 = 0.374 | ||||||||||
| 280.8 | 0.79 | 0.80 | −1.50 | 0.80 | −1.44 | 284.6 | 0.60 | 0.60 | −0.70 | 0.59 | 2.32 |
| 285.6 | 0.89 | 0.89 | 0.06 | 0.89 | 0.05 | 298.2 | 0.81 | 0.79 | 1.60 | 0.80 | 0.63 |
| 291.2 | 1.02 | 1.01 | 1.21 | 1.01 | 1.16 | 306.7 | 0.94 | 0.95 | −1.43 | 0.97 | −2.88 |
| 301.7 | 1.28 | 1.26 | 1.45 | 1.26 | 1.43 | 312.4 | 1.09 | 1.08 | 1.04 | 1.09 | 0.08 |
| 312.6 | 1.54 | 1.57 | −2.54 | 1.57 | −2.51 | 319.3 | 1.24 | 1.27 | −1.88 | 1.26 | −1.57 |
| 318.4 | 1.78 | 1.77 | 0.78 | 1.77 | 0.79 | 321.6 | 1.35 | 1.34 | 1.24 | 1.32 | 2.10 |
| 321.3 | 1.88 | 1.87 | 0.29 | 1.87 | 0.27 | ||||||
| w4 = 0.471 | |||||||||||
| 281.2 | 0.36 | 0.36 | 0.98 | 0.37 | −0.97 | ||||||
| 286.6 | 0.40 | 0.41 | −2.24 | 0.42 | −2.88 | ||||||
| 293.2 | 0.49 | 0.48 | 2.11 | 0.48 | 2.58 | ||||||
| 300.9 | 0.57 | 0.58 | −1.37 | 0.57 | −0.26 | ||||||
| 310.5 | 0.71 | 0.70 | 0.51 | 0.70 | 1.40 | ||||||
| 321.9 | 0.87 | 0.88 | −0.09 | 0.88 | −0.79 | ||||||
Standard uncertainty, u, is u(T) = 2 K. Relative standard uncertainties, ur are ur(p) = 0.1, ur(x1) = 0.01, ur(w3) = 0.001, and ur(w4) = 0.003. refers to the experimental mole fraction solubility. refers to the calculated solubility data using the Apelblat and λh model equations. RD represents the corresponding relative deviation. w3 is the mass fraction of acetone (3) in binary IPA (2) + acetone (3) mixture. w4 is the mass fraction of heptane (4) in ternary IPA (2) + acetone (3) + heptane (4) mixture.
The modified Apelblat and λh model equations were used to correlate the experimental solubility data. Origin was employed to obtain the optimized values for both equations, which allows for direct calculation of the solubility of WS·IPA at a specific temperature in the pure solvents and solvent mixtures studied. The correlation parameters for the Apelblat and λh model equations along with the ARD % for the solubility of WS·IPA in the pure solvents and solvent mixtures studied are listed in Table 14. The low RD and ARD % values demonstrate that the correlated solubility data obtained from the two model equations agree well with the experimental solubility data obtained by employing the polythermal method, with the exception of the pure solvent, water that shows a relatively high ARD % (32.0817) when correlated with the λh model equation. The latter is in strong contrast with the correlated data for the Apelblat model equation, which presents a much lower ARD % (3.6525). In general, the Apelblat model equation was found to give better correlation results for pure solvents as well as binary and ternary solvent mixtures compared to the λh model equation. Unlike the Apelblat model equation, the λh model equation depends on the accurate determination of the Tm of the solute, as a parameter to accurately correlate the experimental solubility data. Owing to the desolvation of WS·IPA upon heating, the Tm determined here and used to correlate the experimental solubility data in the λh model equation corresponds to the desolvated form of WS·IPA, and thus, WS. On this account, it can be concluded that the Apelblat model equation represents the better model to calculate the solubility behavior of WS·IPA, when compared to the λh model equation.
Table 14.
Optimized Values for the Parameters in the Apelblat and λh Model Equations, and the Resulting ARD % Employed for the Correlation of the Mole Fraction Solubility of WS·IPA (1) in All Pure Solvents and Binary and Ternary Solvent Mixturesa
| solvent | model |
||||||
|---|---|---|---|---|---|---|---|
| Apelblat |
λh |
||||||
| A | B | C | ARD % | λ | h | ARD % | |
| acetone | 40.19227 | −4453.5832 | −5.21225 | 0.1030 | 0.34847 | 8024.47622 | 0.3660 |
| ethanol | −98.21059 | 2934.77406 | 14.91362 | 0.0123 | 0.13573 | 9541.11686 | 0.0987 |
| IPA | −168.14598 | 4845.50445 | 25.46934 | 0.1951 | 0.03625 | 78 532.6849 | 0.9253 |
| water | 793.0886 | −42 237.216 | −115.22091 | 3.6525 | 8.73772 | 660.34109 | 32.0817 |
| IPA (2) + Acetone (3)b | |||||||
| w3 = 0.047 | −212.42314 | 7620.28099 | 31.70073 | 0.0858 | 0.0136 | 124 024.946 | 0.1193 |
| w3 = 0.111 | −95.7517 | 2118.49529 | 14.54609 | 0.1155 | 0.03775 | 55 476.8042 | 0.0456 |
| w3 = 0.148 | −23.30329 | −803.09409 | 3.60796 | 0.1503 | 0.02654 | 60 467.0328 | 0.1694 |
| IPA (2) + Ethanol (3)c | |||||||
| w3 = 0.099 | −49.0643 | −412.16498 | 7.75605 | 0.1295 | 0.04747 | 55 929.5443 | 0.0081 |
| w3 = 0.202 | −72.05357 | 675.82423 | 11.19978 | 0.0020 | 0.06172 | 42 751.0333 | 0.3544 |
| w3 = 0.304 | −27.7247 | −800.16381 | 4.44694 | 0.0121 | 0.0593 | 32 320.5083 | 0.0435 |
| IPA (2) + Water (3)d | |||||||
| w3 = 0.013 | 31.56036 | −4174.5572 | −4.12862 | 1.0052 | 0.07245 | 38 146.7916 | 1.5042 |
| w3 = 0.026 | −100.15491 | 2075.94625 | 15.40812 | 0.0228 | 0.09892 | 25 877.8135 | 0.3936 |
| w3 = 0.036 | 36.26167 | −4093.4908 | −4.81959 | 0.0357 | 0.13913 | 17 670.9545 | 0.3256 |
| IPA (2) + Heptane (3)e | |||||||
| w3 = 0.091 | 50.53958 | −5066.4769 | −7.09047 | 0.1446 | 0.0299 | 92 694.4175 | 0.4728 |
| w3 = 0.176 | 106.29142 | −7713.3439 | −15.36234 | 0.0812 | 0.02344 | 11 8496.523 | 0.8084 |
| w3 = 0.277 | −88.53187 | 1585.64037 | 13.32239 | 0.0129 | 0.01125 | 209 260.365 | 0.1929 |
| w3 = 0.372 | −6.55071 | −2408.948 | 1.22208 | 0.1943 | 0.01101 | 238 084.753 | 0.3382 |
| w3 = 0.469 | 28.14306 | −4201.1073 | −3.88435 | 0.2881 | 0.00971 | 293 134.792 | 0.8425 |
| IPA (2) + Hexane (3)f | |||||||
| w3 = 0.085 | −10.49662 | −2360.7192 | 2.02504 | 0.0877 | 0.03317 | 86 435.2206 | 0.0502 |
| w3 = 0.172 | 43.76406 | −4715.7858 | −6.15163 | 0.1459 | 0.0207 | 129 308.108 | 0.3790 |
| IPA (2) + Hexane (3)f | |||||||
| w3 = 0.267 | −81.0248 | 878.56894 | 12.40759 | 0.6470 | 0.01902 | 148 332.957 | 0.1385 |
| w3 = 0.361 | −95.26691 | 1870.07397 | 14.28232 | 0.1198 | 0.00835 | 282 981.301 | 0.2490 |
| w3 = 0.456 | −174.43438 | 5826.06284 | 25.80672 | 0.0582 | 0.00314 | 570 874.136 | 0.2838 |
| IPA (2) + Acetone (3) + Heptane (4)g | |||||||
| w4 = 0.088 | 7.45879 | −2444.78 | −0.94003 | 0.0027 | 0.02153 | 89 779.026 | 0.1007 |
| w4 = 0.179 | 71.51033 | −5320.9624 | −10.53596 | 0.0267 | 0.01549 | 122 335.377 | 0.2327 |
| w4 = 0.274 | −40.35096 | −100.03658 | 5.95624 | 0.0370 | 0.00723 | 223 111.18 | 0.0360 |
| w4 = 0.374 | −157.71758 | 5115.82168 | 23.4169 | 0.0222 | 0.00606 | 290 073.46 | 0.1133 |
| w4 = 0.471 | 31.45409 | −3424.6109 | −4.82412 | 0.0160 | 0.00365 | 460 216.839 | 0.1538 |
| IPA (2) + Acetone (3) + Hexane (4)h | |||||||
| w4 = 0.086 | 71.69696 | −5087.9876 | −10.64908 | 0.0203 | 0.01394 | 113 907.03 | 0.2106 |
| w4 = 0.174 | 119.41188 | −7483.9616 | −17.66924 | 0.0212 | 0.01576 | 121 435.344 | 0.4989 |
| w4 = 0.272 | −100.48322 | 2701.47644 | 14.8711 | 0.0020 | 0.00603 | 239 291.013 | 0.0421 |
| w4 = 0.366 | 2.65773 | −1985.3615 | −0.54043 | 0.0762 | 0.00448 | 338 221.978 | 0.1394 |
| w4 = 0.468 | 48.96548 | −4360.3244 | −7.35507 | 0.0204 | 0.00491 | 393 689.135 | 0.1541 |
| IPA (2) + Ethanol (3) + Heptane (4)i | |||||||
| w4 = 0.087 | −58.08448 | 75.97897 | 9.06933 | 0.0931 | 0.0465 | 55 061.4056 | 0.0683 |
| w4 = 0.180 | −131.15428 | 3455.69773 | 19.8809 | 0.1831 | 0.0398 | 63 854.5224 | 0.2455 |
| w4 = 0.270 | −30.03447 | −1123.4194 | 4.75911 | 0.0633 | 0.02235 | 107 641.145 | 0.0579 |
| w4 = 0.376 | −54.80922 | 89.13291 | 8.33145 | 0.0702 | 0.01314 | 172 514.828 | 0.0534 |
| w4 = 0.470 | −14.98909 | −1426.7894 | 2.18895 | 0.1676 | 0.00554 | 328 688.036 | 0.2683 |
| IPA (2) + Ethanol (3) + Hexane (4)j | |||||||
| w4 = 0.084 | −129.22928 | 3492.20594 | 19.55325 | 0.0181 | 0.03917 | 60 927.654 | 0.4628 |
| w4 = 0.173 | 77.38158 | −6026.0412 | −11.14761 | 0.0525 | 0.03269 | 74 848.3745 | 0.5174 |
| w4 = 0.268 | −109.48199 | 2722.35279 | 16.45304 | 0.0394 | 0.01786 | 121 643.807 | 0.2920 |
| w4 = 0.359 | −89.00989 | 1697.60223 | 13.41346 | 0.0502 | 0.01462 | 152 936.509 | 0.0423 |
| w4 = 0.462 | −96.50606 | 2117.21059 | 14.40116 | 0.0733 | 0.00743 | 278 107.384 | 0.1154 |
| IPA (2) + Water (3) + Heptane (4)k | |||||||
| w4 = 0.087 | 29.09294 | −3901.1315 | −3.86842 | 0.2664 | 0.05081 | 49 968.9272 | 0.6028 |
| w4 = 0.178 | −26.0761 | −1314.9426 | 4.26366 | 0.0532 | 0.03918 | 62 747.9646 | 0.0418 |
| w4 = 0.275 | −112.43256 | 2860.93181 | 16.91358 | 0.0153 | 0.01922 | 110 043.434 | 0.2888 |
| w4 = 0.386 | 4.36243 | −2446.9006 | −0.52602 | 0.1576 | 0.01206 | 170 499.156 | 0.2884 |
| w4 = 0.473 | −47.18466 | 94.09656 | 6.9711 | 0.0035 | 0.00596 | 295 426.336 | 0.0158 |
ARD % represents the corresponding average relative deviation.
w3 is the mass fraction of acetone (3) in binary IPA (2) + acetone (3) mixture.
w3 is the mass fraction of ethanol (3) in binary IPA (2) + ethanol (3) mixture.
w3 is the mass fraction of water (3) in binary IPA (2) + water (3) mixture.
w3 is the mass fraction of heptane (3) in binary IPA (2) + heptane (3) mixture.
w3 is the mass fraction of hexane (3) in binary IPA (2) + hexane (3) mixture.
w4 is the mass fraction of heptane (4) in ternary IPA (2) + acetone (3) with w3 = 0.095 + heptane (4) mixture.
w4 is the mass fraction of hexane (4) in ternary IPA (2) + acetone (3) with w3 = 0.095 + hexane (4) mixture.
w4 is the mass fraction of heptane (4) in ternary IPA (2) + ethanol (3) with w3 = 0.198 + heptane (4) mixture.
w4 is the mass fraction of hexane (4) in ternary IPA (2) + ethanol (3) with w3 = 0.198 + hexane (4) mixture.
w4 is the mass fraction of heptane (4) in ternary IPA (2) + water (3) with w3 = 0.013 + heptane (4) mixture.
On the basis of Figure 3, it can be concluded that the solubility of WS·IPA increases with increasing temperature in all pure solvents employed in this study. The solubility of WS·IPA in the pure solvents ranks as follows: ethanol > acetone > water > IPA below 310 K, and ethanol > water > acetone > IPA above 310 K. The solubility of WS·IPA in heptane and hexanes is extremely low, <0.2 mg/mL, in the temperature range studied (278.15−333.15 K). Therefore, the solubility of WS·IPA could not be determined in these two pure solvents; instead, heptane and hexanes were used as antisolvents in some of the binary and all ternary solvent mixtures.
Figure 3.

Experimental and correlated solubility data of WS·IPA in pure solvents; ◊, ethanol; □, acetone; ○, water; and △, IPA; –, calculated using the modified Apelblat equation. x1 represents the mole fraction solubility of WS·IPA, and T is the temperature in kelvin (K).
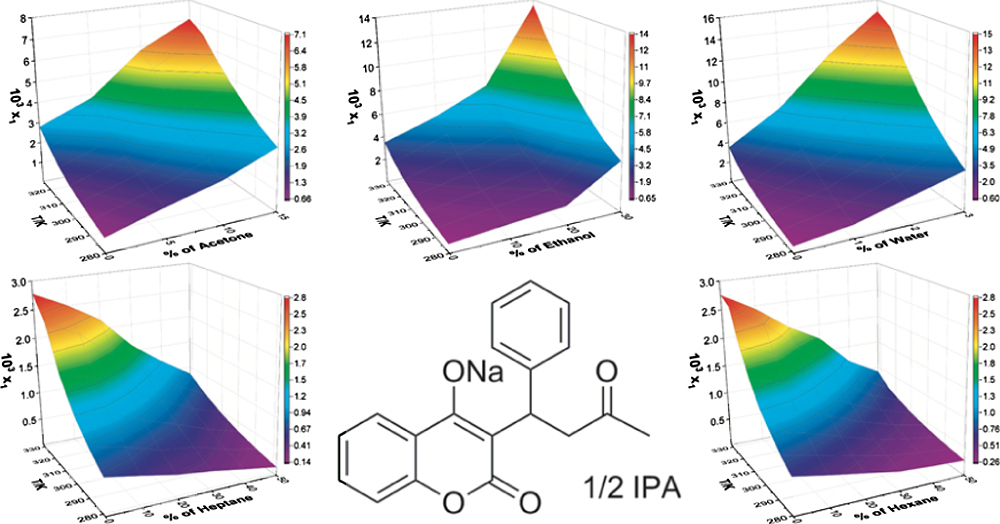
The experimental and correlated mole faction solubility of WS·IPA based on the modified Apelblat equation in the binary and ternary solvent mixtures are shown as surface plots in Figures 4 and 5, respectively. Figures presenting the experimental and correlated mole faction solubility of WS·IPA using the λh model equation can be found in the Supporting Information. Figure 4a–c shows that the solubility of WS·IPA increases with increasing the weight fraction of acetone, ethanol, and water in these binary solvent mixtures and that these exceed the solubility of WS·IPA in pure IPA. This demonstrates that all three solvents (acetone, ethanol, and water) can be utilized as cosolvents to increase the solubility of WS·IPA in IPA.64–66 Figures 4d,e and 5a–e show that in both binary and ternary solvent mixtures, the solubility of WS·IPA decreases with increasing content of hexane and heptane because of the extremely low solubility of WS·IPA in these two pure solvents. Thus, hexane and heptane can be employed as antisolvents when developing an antisolvent cooling crystallization method for WS·IPA.
Figure 4.

Surface plots for the solubility of WS·IPA (1) in binary solvent systems, (a) IPA (2) + acetone (3), (b) IPA (2) + ethanol (3), (c) IPA (2) + water (3), (d) IPA (2) + heptane (3), and (e) IPA (2) + hexane (3) correlated with the modified Apelblat equation. x1 represents the mole fraction solubility of WS·IPA, and T is the temperature in kelvin (K).
Figure 5.

Surface plots for the solubility of WS·IPA (1) in ternary solvent systems, (a) IPA (2) + acetone (3) with w3 = 0.095 + heptane (4), (b) IPA (2) + acetone (3) with w3 = 0.095 + hexane (4), (c) IPA (2) + ethanol (3) with w3 = 0.198 + heptane (4), (d) IPA (2) + ethanol (3) with w3 = 0.198 + hexane (4), and (e) IPA (2) + water (3) with w3 = 0.013 + heptane (4) correlated with the modified Apelblat equation. x1 represents the mole fraction solubility of WS·IPA, and T is the temperature in kelvin (K).
CONCLUSIONS
The solubility of WS·IPA in four pure solvents and five binary and five ternary solvent mixtures was experimentally measured from 278.15 to 333.15 K using the polythermal method enabled by the use of a Crystal16 multiple reactor system. The experimental data were correlated using the modified Apelblat and λh model equations to provide a general quantification of the solubility profiles for this highly prescribed pharmaceutical compound. The low RD and ARD % values obtained indicate that the correlated solubility data obtained employing the two model equations agree well with the experimental solubility data. Even though both the modified Apelblat and λh model equations do not take into consideration the solvent composition and require separate parameters for each solvent, they provide a direct approach to calculate the solubility of WS·IPA in various solvents and solvent mixtures. The presence of IPA in all binary and ternary solvent systems ensured that the crystalline phase of recovered material corresponded to the active form, WS·IPA, used in pharmaceutical formulations of this drug. Based on the correlated and experimentally derived solubility data, the selected solvent mixtures are potential candidates to be employed as cosolvents and antisolvents when developing enhanced pharmaceutical crystallization processes for the WS·IPA clathrate.
Supplementary Material
Table 5.
Experimental and Correlated Mole Fraction Solubility of WS·IPA (x1) in the Binary Solvent Mixture of IPA (2) + Ethanol (3) at Different Temperatures, T, and at Pressure, p = 101.3 kPaa
| Apelblat |
λh |
Apelblat |
λh |
||||||||
|---|---|---|---|---|---|---|---|---|---|---|---|
| T/K | 103 | 103 | 102 RD | 103 | 102 RD | T/K | 103 | 103 | 102 RD | 103 | 102 RD |
| w3 = 0.099 | w3 = 0.202 | ||||||||||
| 282.5 | 1.11 | 1.17 | −5.20 | 1.16 | −4.18 | 280.6 | 1.48 | 1.48 | −0.22 | 1.44 | 2.41 |
| 285.6 | 1.32 | 1.29 | 2.44 | 1.28 | 3.00 | 287.9 | 1.87 | 1.86 | 0.36 | 1.84 | 1.22 |
| 289.6 | 1.50 | 1.47 | 2.31 | 1.47 | 2.46 | 304.7 | 3.08 | 3.08 | −0.09 | 3.11 | −1.05 |
| 303.9 | 2.27 | 2.28 | −0.70 | 2.29 | −1.21 | 317.6 | 4.47 | 4.48 | −0.32 | 4.52 | −1.04 |
| 312.3 | 2.95 | 2.92 | 0.91 | 2.94 | 0.48 | 324.4 | 5.46 | 5.44 | 0.40 | 5.45 | 0.22 |
| 322.4 | 3.85 | 3.90 | −1.18 | 3.90 | −1.25 | 330.7 | 6.47 | 6.48 | −0.13 | 6.45 | 0.36 |
| 328.2 | 4.60 | 4.58 | 0.52 | 4.57 | 0.75 | ||||||
| w3 = 0.304 | |||||||||||
| 284.4 | 4.48 | 4.46 | 0.39 | 4.47 | 0.07 | ||||||
| 296.4 | 5.93 | 6.01 | −1.23 | 6.01 | −1.33 | ||||||
| 307.4 | 7.83 | 7.78 | 0.66 | 7.77 | 0.76 | ||||||
| 316.2 | 9.57 | 9.48 | 0.90 | 9.47 | 1.08 | ||||||
| 326.4 | 11.67 | 11.82 | −1.29 | 11.81 | −1.21 | ||||||
| 332.9 | 13.61 | 13.54 | 0.50 | 13.56 | 0.37 | ||||||
Standard uncertainty, u, is u(T) = 2 K. Relative standard uncertainties, ur are ur(p) = 0.1, ur(x1) = 0.01,and ur(w3) = 0.001. refers to the experimental mole fraction solubility. refers to the calculated solubility data using the Apelblat and λh model equations. RD represents the corresponding relative deviation. w3 is the mass fraction of ethanol (3) in a binary IPA (2) + ethanol (3) mixture.
Table 6.
Experimental and Correlated Mole Fraction Solubility of WS·IPA (x1) in the Binary Solvent Mixture of IPA (2) + Water (3) at Different Temperatures, T, and at Pressure, p = 101.3 kPaa
| Apelblat |
λh |
Apelblat |
λh |
||||||||
|---|---|---|---|---|---|---|---|---|---|---|---|
| T/K | 103 | 103 | 102 RD | 103 | 102 RD | T/K | 103 | 103 | 102 RD | 103 | 102 RD |
| w3 = 0.013 | w3 = 0.026 | ||||||||||
| 278.9 | 1.13 | 1.28 | −13.46 | 1.33 | −17.21 | 283.6 | 3.00 | 2.97 | 0.83 | 2.86 | 4.52 |
| 290.7 | 2.18 | 1.99 | 8.61 | 2.00 | 8.01 | 295.2 | 4.11 | 4.14 | −0.73 | 4.13 | −0.54 |
| 305.4 | 3.25 | 3.24 | 0.39 | 3.21 | 1.22 | 308.7 | 6.05 | 6.06 | −0.15 | 6.14 | −1.50 |
| 314.9 | 4.27 | 4.31 | −1.02 | 4.27 | −0.18 | 319.4 | 8.18 | 8.17 | 0.05 | 8.25 | −0.92 |
| 322.8 | 5.30 | 5.38 | −1.61 | 5.37 | −1.36 | 327.4 | 10.26 | 10.21 | 0.52 | 10.21 | 0.57 |
| 328.9 | 6.40 | 6.33 | 1.06 | 6.37 | 0.50 | 330.7 | 11.14 | 11.19 | −0.38 | 11.12 | 0.23 |
| w3 = 0.036 | |||||||||||
| 279.6 | 3.94 | 3.96 | −0.49 | 4.09 | −3.82 | ||||||
| 295.0 | 6.60 | 6.57 | 0.48 | 6.58 | 0.43 | ||||||
| 301.9 | 7.99 | 8.07 | −1.04 | 8.02 | −0.42 | ||||||
| 308.7 | 9.96 | 9.78 | 1.80 | 9.70 | 2.61 | ||||||
| 316.6 | 11.91 | 12.05 | −1.17 | 11.99 | −0.63 | ||||||
| 322.9 | 14.07 | 14.10 | −0.23 | 14.12 | −0.33 | ||||||
| 325.8 | 15.19 | 15.12 | 0.40 | 15.20 | −0.11 | ||||||
Standard uncertainty, u, is u(T) = 2 K. Relative standard uncertainties, ur are ur(p) = 0.1, ur(x1) = 0.01, and ur(w3) = 0.001. refers to the experimental mole fraction solubility. refers to the calculated solubility data using the Apelblat and λh model equations. RD represents the corresponding relative deviation. w3 is the mass fraction of water (3) in a binary IPA (2) + water (3) mixture.
Table 7.
Experimental and Correlated Mole Fraction Solubility of WS·IPA (x1) in the Binary Solvent Mixture of IPA (2) + Heptane (3) at Different Temperatures, T, and at Pressure, p = 101.3 kPaa
| Apelblat |
λh |
Apelblat |
λh |
||||||||
|---|---|---|---|---|---|---|---|---|---|---|---|
| T/K | 103 | 103 | 102 RD | 103 | 102 RD | T/K | 103 | 103 | 102 RD | 103 | 102 RD |
| w3 = 0.091 | w3 = 0.176 | ||||||||||
| 283.4 | 0.59 | 0.62 | −4.95 | 0.64 | −6.96 | 283.6 | 0.50 | 0.47 | 7.18 | 0.50 | 1.06 |
| 285.7 | 0.70 | 0.68 | 2.06 | 0.69 | 0.80 | 291.9 | 0.60 | 0.65 | −7.91 | 0.66 | −9.94 |
| 289.3 | 0.79 | 0.78 | 2.00 | 0.78 | 1.57 | 309.2 | 1.19 | 1.18 | 1.29 | 1.15 | 3.58 |
| 300.5 | 1.15 | 1.14 | 0.67 | 1.13 | 1.76 | 321.6 | 1.68 | 1.69 | −0.06 | 1.66 | 1.42 |
| 311.7 | 1.60 | 1.61 | −0.82 | 1.59 | 0.34 | 326.4 | 1.91 | 1.91 | 0.17 | 1.90 | 0.53 |
| 324.4 | 2.30 | 2.30 | 0.16 | 2.31 | −0.35 | 331.5 | 2.16 | 2.17 | −0.18 | 2.19 | −1.50 |
| w3 = 0.277 | w3 = 0.372 | ||||||||||
| 287.2 | 0.50 | 0.50 | 0.62 | 0.49 | 2.41 | 282.7 | 0.27 | 0.28 | −3.75 | 0.28 | −4.69 |
| 296.9 | 0.64 | 0.65 | −0.65 | 0.65 | −0.74 | 293.2 | 0.41 | 0.40 | 3.52 | 0.40 | 3.39 |
| 313.7 | 1.01 | 1.01 | −0.09 | 1.02 | −1.01 | 317.3 | 0.81 | 0.82 | −1.25 | 0.82 | −0.77 |
| 323.0 | 1.30 | 1.29 | 0.32 | 1.30 | −0.03 | 327.0 | 1.07 | 1.07 | 0.66 | 1.07 | 0.77 |
| 330.4 | 1.56 | 1.56 | −0.13 | 1.56 | 0.33 | 331.8 | 1.21 | 1.21 | −0.15 | 1.21 | −0.39 |
| w3 = 0.469 | |||||||||||
| 278.4 | 0.14 | 0.15 | −2.63 | 0.15 | −6.85 | ||||||
| 295.2 | 0.28 | 0.28 | 0.38 | 0.28 | 0.04 | ||||||
| 307.2 | 0.42 | 0.42 | 0.71 | 0.41 | 1.50 | ||||||
| 316.7 | 0.57 | 0.56 | 1.78 | 0.55 | 2.59 | ||||||
| 326.2 | 0.71 | 0.73 | −3.97 | 0.73 | −3.86 | ||||||
| 330.5 | 0.84 | 0.82 | 2.00 | 0.83 | 1.53 | ||||||
Standard uncertainty, u, is u(T) = 2 K. Relative standard uncertainties, ur are ur(p) = 0.1, ur(x1) = 0.01, and ur(w3) = 0.001. refers to the experimental mole fraction solubility . refers to the calculated solubility data using the Apelblat and λh model equations. RD represents the corresponding relative deviation. w3 is the mass fraction of heptane (3) in a binary IPA (2) + heptane (3) mixture.
Table 10.
Experimental and Correlated Mole Fraction Solubility of WS·IPA (x1) in the Ternary Solvent Mixture of IPA (2) + Acetone (3) with w3 = 0.095 + Hexane (4) at Different Temperatures, T, and at Pressure, p = 101.3 kPaa
| Apelblat |
λh |
Apelblat |
λh |
||||||||
|---|---|---|---|---|---|---|---|---|---|---|---|
| T/K | 103 | 103 | 102 RD | 103 | 102 RD | T/K | 103 | 103 | 102 RD | 103 | 102 RD |
| w4 = 0.086 | w4 = 0.174 | ||||||||||
| 280.1 | 1.52 | 1.54 | −1.32 | 1.58 | −4.15 | 279.8 | 1.03 | 1.02 | 0.92 | 1.06 | −3.28 |
| 285.8 | 1.81 | 1.78 | 1.49 | 1.79 | 0.86 | 281.0 | 1.07 | 1.06 | 0.67 | 1.10 | −2.77 |
| 291.5 | 2.04 | 2.04 | 0.01 | 2.03 | 0.83 | 285.8 | 1.21 | 1.23 | −1.54 | 1.24 | −2.43 |
| 304.2 | 2.68 | 2.69 | −0.36 | 2.64 | 1.44 | 296.5 | 1.66 | 1.65 | 0.24 | 1.62 | 2.59 |
| 312.4 | 3.14 | 3.14 | −0.01 | 3.12 | 0.89 | 303.7 | 1.96 | 1.97 | −0.70 | 1.91 | 2.13 |
| 320.8 | 3.63 | 3.63 | 0.07 | 3.68 | −1.14 | 312.6 | 2.40 | 2.38 | 0.79 | 2.35 | 2.42 |
| 322.7 | 2.87 | 2.88 | −0.23 | 2.93 | −2.15 | ||||||
| w4 = 0.272 | w4 = 0.366 | ||||||||||
| 279.8 | 0.87 | 0.87 | −0.06 | 0.86 | 1.31 | 279.4 | 0.54 | 0.56 | −2.35 | 0.56 | −3.51 |
| 286.3 | 0.99 | 0.99 | 0.49 | 0.98 | 0.61 | 287.6 | 0.67 | 0.67 | 0.45 | 0.67 | 0.45 |
| 293.4 | 1.12 | 1.13 | −0.77 | 1.14 | −1.38 | 294.5 | 0.80 | 0.78 | 2.96 | 0.77 | 3.52 |
| 299.1 | 1.26 | 1.26 | 0.12 | 1.27 | −0.64 | 311.6 | 1.07 | 1.09 | −2.12 | 1.09 | −1.59 |
| 307.9 | 1.51 | 1.50 | 0.67 | 1.51 | 0.28 | 315.6 | 1.17 | 1.18 | −0.27 | 1.18 | −0.07 |
| 312.6 | 1.64 | 1.65 | −0.66 | 1.65 | −0.59 | 321.6 | 1.32 | 1.31 | 0.88 | 1.32 | 0.36 |
| 315.9 | 1.76 | 1.76 | 0.20 | 1.75 | 0.69 | ||||||
| w4 = 0.468 | |||||||||||
| 281.1 | 0.33 | 0.33 | −0.89 | 0.33 | −2.36 | ||||||
| 284.3 | 0.36 | 0.36 | 0.73 | 0.36 | 0.14 | ||||||
| 301.5 | 0.56 | 0.56 | 0.59 | 0.55 | 1.94 | ||||||
| 311.4 | 0.69 | 0.70 | −1.64 | 0.70 | −0.99 | ||||||
| 315.0 | 0.77 | 0.76 | 1.31 | 0.75 | 1.36 | ||||||
| 318.9 | 0.82 | 0.82 | −0.23 | 0.82 | −1.01 | ||||||
Standard uncertainty, u, is u(T) = 2 K. Relative standard uncertainties, ur are ur(p) = 0.1, ur(x1) = 0.01, ur(w3) = 0.001, and ur(w4) = 0.003. refers to the experimental mole fraction solubility. refers to the calculated solubility data using the Apelblat and λh model equations. RD represents the corresponding relative deviation. w3 is the mass fraction of acetone (3) in binary IPA (2) + acetone (3) mixture. w4 is the mass fraction of hexane (4) in ternary IPA (2) + acetone (3) + hexane (4) mixture.
Table 11.
Experimental and Correlated Mole Fraction Solubility of WS·IPA (x1) in the Ternary Solvent Mixture of IPA (2) + Ethanol (3) with w3 = 0.198 + Heptane (4) at Different Temperatures, T, and at Pressure, p = 101.3 kPaa
| Apelblat |
λh |
Apelblat |
λh |
||||||||
|---|---|---|---|---|---|---|---|---|---|---|---|
| T/K | 103 | 103 | 102 RD | 103 | 102 RD | T/K | 103 | 103 | 102 RD | 103 | 102 RD |
| w4 = 0.087 | w4 = 0.180 | ||||||||||
| 282.7 | 1.30 | 1.32 | −2.29 | 1.31 | −0.97 | 283.5 | 1.18 | 1.24 | −4.98 | 1.18 | −0.16 |
| 290.7 | 1.72 | 1.69 | 1.68 | 1.69 | 1.86 | 288.9 | 1.44 | 1.43 | 0.75 | 1.40 | 2.85 |
| 304.8 | 2.60 | 2.57 | 0.99 | 2.59 | 0.41 | 298.0 | 1.87 | 1.84 | 1.54 | 1.86 | 0.90 |
| 315.9 | 3.49 | 3.53 | −1.12 | 3.54 | −1.50 | 304.8 | 2.35 | 2.23 | 5.00 | 2.27 | 3.42 |
| 326.6 | 4.75 | 4.73 | 0.28 | 4.72 | 0.54 | 314.1 | 2.79 | 2.90 | −3.70 | 2.95 | −5.48 |
| 322.7 | 3.67 | 3.70 | −0.67 | 3.72 | −1.30 | ||||||
| 326.7 | 4.13 | 4.14 | −0.32 | 4.13 | −0.11 | ||||||
| 329.8 | 4.57 | 4.52 | 0.91 | 4.48 | 1.85 | ||||||
| w4 = 0.270 | w4 = 0.376 | ||||||||||
| 280.3 | 0.74 | 0.73 | 1.42 | 0.73 | 1.48 | 280.3 | 0.52 | 0.53 | −2.44 | 0.53 | −1.46 |
| 284.8 | 0.85 | 0.84 | 0.89 | 0.84 | 0.84 | 286.8 | 0.66 | 0.64 | 2.28 | 0.64 | 2.49 |
| 298.6 | 1.22 | 1.26 | −3.12 | 1.26 | −3.24 | 305.1 | 1.05 | 1.05 | 0.29 | 1.06 | −0.21 |
| 313.7 | 1.94 | 1.91 | 1.49 | 1.91 | 1.53 | 313.9 | 1.31 | 1.32 | −0.63 | 1.33 | −0.94 |
| 322.8 | 2.42 | 2.42 | −0.20 | 2.42 | −0.12 | 326.1 | 1.80 | 1.80 | 0.15 | 1.79 | 0.38 |
| 333.0 | 3.12 | 3.13 | −0.10 | 3.13 | −0.14 | ||||||
| w4 = 0.470 | |||||||||||
| 279.4 | 0.40 | 0.42 | −5.50 | 0.43 | −6.64 | ||||||
| 287.4 | 0.55 | 0.52 | 4.81 | 0.52 | 4.47 | ||||||
| 299.7 | 0.71 | 0.70 | 1.07 | 0.70 | 1.43 | ||||||
| 314.6 | 0.95 | 0.97 | −2.23 | 0.97 | −1.72 | ||||||
| 320.4 | 1.09 | 1.10 | −0.93 | 1.10 | −0.64 | ||||||
| 324.4 | 1.22 | 1.19 | 1.93 | 1.19 | 1.98 | ||||||
| 330.1 | 1.33 | 1.34 | −0.32 | 1.34 | −0.76 | ||||||
Standard uncertainty, u, is u(T) = 2 K. Relative standard uncertainties, ur are ur(p) = 0.1, ur(x1) = 0.01, ur(w3) = 0.001, and ur(w4) = 0.003. refers to the experimental mole fraction solubility. refers to the calculated solubility data using the Apelblat and λh model equations. RD represents the corresponding relative deviation. w3 is the mass fraction of ethanol (3) in binary IPA (2) + ethanol (3) mixture. w4 is the mass fraction of heptane (4) in ternary IPA (2) + ethanol (3) + heptane (4) mixture.
Table 12.
Experimental and Correlated Mole Fraction Solubility of WS·IPA (x1) in the Ternary Solvent Mixture of IPA (2) + Ethanol (3) with w3 = 0.198 + Hexane (4) at Different Temperatures, T, and at Pressure, p = 101.3 kPaa
| Apelblat |
λh |
Apelblat |
λh |
||||||||
|---|---|---|---|---|---|---|---|---|---|---|---|
| T/K | 103 | 103 | 102 RD | 103 | 102 RD | T/K | 103 | 103 | 102 RD | 103 | 102 RD |
| w4 = 0.084 | w4 = 0.173 | ||||||||||
| 284.2 | 1.53 | 1.54 | −0.63 | 1.48 | 3.32 | 282.5 | 1.05 | 1.04 | 0.46 | 1.08 | −2.75 |
| 288.7 | 1.74 | 1.73 | 0.08 | 1.70 | 2.03 | 286.0 | 1.16 | 1.18 | −2.16 | 1.20 | −3.95 |
| 303.6 | 2.59 | 2.56 | 1.09 | 2.61 | −0.61 | 290.4 | 1.38 | 1.37 | 0.89 | 1.38 | 0.61 |
| 315.6 | 3.50 | 3.53 | −0.90 | 3.59 | −2.73 | 303.2 | 2.06 | 2.04 | 1.23 | 2.00 | 3.11 |
| 324.8 | 4.54 | 4.52 | 0.26 | 4.55 | −0.26 | 314.5 | 2.74 | 2.77 | −0.93 | 2.72 | 0.62 |
| 331.6 | 5.44 | 5.44 | 0.00 | 5.39 | 1.03 | 326.1 | 3.66 | 3.65 | 0.20 | 3.69 | −0.74 |
| w4 = 0.268 | w4 = 0.359 | ||||||||||
| 284.3 | 0.95 | 0.96 | −1.04 | 0.93 | 2.66 | 288.3 | 0.77 | 0.79 | −2.11 | 0.77 | −0.70 |
| 294.5 | 1.24 | 1.23 | 0.40 | 1.23 | 0.93 | 296.3 | 0.99 | 0.97 | 2.54 | 0.97 | 2.57 |
| 306.1 | 1.68 | 1.64 | 2.22 | 1.66 | 1.14 | 307.3 | 1.27 | 1.29 | −0.85 | 1.29 | −1.51 |
| 313.4 | 1.92 | 1.96 | −2.22 | 1.99 | −3.47 | 312.9 | 1.50 | 1.48 | 0.91 | 1.49 | 0.35 |
| 321.2 | 2.39 | 2.38 | 0.33 | 2.40 | −0.40 | 320.5 | 1.77 | 1.80 | −1.60 | 1.80 | −1.67 |
| 332.1 | 3.13 | 3.12 | 0.07 | 3.10 | 0.89 | 325.1 | 2.04 | 2.02 | 0.80 | 2.01 | 1.21 |
| w4 = 0.462 | |||||||||||
| 280.1 | 0.40 | 0.41 | −2.17 | 0.40 | 0.54 | ||||||
| 289.7 | 0.52 | 0.52 | 0.65 | 0.52 | 0.85 | ||||||
| 300.2 | 0.69 | 0.67 | 1.97 | 0.68 | 0.94 | ||||||
| 312.6 | 0.92 | 0.91 | 0.70 | 0.92 | −0.25 | ||||||
| 319.0 | 1.04 | 1.06 | −2.20 | 1.07 | −2.60 | ||||||
| 323.6 | 1.18 | 1.19 | −0.99 | 1.19 | −0.80 | ||||||
| 326.3 | 1.29 | 1.27 | 1.54 | 1.26 | 2.12 | ||||||
Standard uncertainty, u, is u(T) = 2 K. Relative standard uncertainties, ur are ur(p) = 0.1, ur(x1) = 0.01, ur(w3) = 0.001, and ur(w4) = 0.003. refers to the experimental mole fraction solubility. refers to the calculated solubility data using the Apelblat and λh model equations. RD represents the corresponding relative deviation. w3 is the mass fraction of ethanol (3) in binary IPA (2) + ethanol (3) mixture. w4 is the mass fraction of hexane (4) in ternary IPA (2) + ethanol (3) + hexane (4) mixture.
ACKNOWLEDGMENTS
The authors gratefully acknowledge the support of the members of the Crystallization Design Institute, Alondra Rivera, Waldemar Rodriǵuez, and Israel Rodriǵuez for the PXRD analysis preformed as well as the help of Amy Wagner from Technobis Crystallization Systems.
Funding
This work was supported primarily by the Puerto Rico Science, Technology & Research Trust under award number 2016–00082. This work was also supported in part by the Puerto Rico Institute for Functional Nanomaterials (EPS-100241). Infrastructure support was provided in part by grants from the National Institute on Minority Health and Health Disparities (8G12MD007600). The Rigaku XtaLAB SuperNova single crystal X-ray micro diffractometer was acquired through the support of the National Science Foundation under the Major Research Instrumentation Program (CHE-1626103).
NOMENCLATURE
- A, B, C
empirical model parameters for Apelblat equation
- ARD %
average relative deviation
- DSC
differential scanning calorimetry
- h
model parameter for λh equation representing excess
- IPA
isopropanol
- m
mass (g)
- M
molecular mass (g mol−1)
- PXRD
powder X-ray diffraction
- RD
relative deviation
- T
absolute temperature (K)
- Tm
melting temperature of WS (K)
- u
standard uncertainty
- ur
relative standard uncertainty
- w
solvent mixture compositions
- WS
warfarin sodium
- WS·IPA
warfarin sodium isopropanol solvate
- x1
mole fraction solubility of WS·IPA (mol)
correlated mole fraction solubility of WS·IPA (mol)
experimental mole fraction solubility of WS·IPA (mol)
GREEK SYMBOLS
- ΔfusH
molar fusion enthalpy
- λ
model parameter for λh equation representing non-ideal properties of the system
- λmax
maximum wavelength of absorption in UV−vis measurements
Footnotes
ASSOCIATED CONTENT
Supporting Information
The Supporting Information is available free of charge on the ACS Publications website at DOI: 10.1021/acs.jced.8b00977.
Detailed experimental procedure for the solubility curves of WS·IPA in pure solvents and binary and ternary solvent mixtures, calculated surface plots of WS·IPA in binary and ternary solvent mixtures using the λh model equation, Raman spectra, powder X-ray diffractograms, and DSC and TGA thermographs (PDF)
Notes
The authors declare no competing financial interest.
REFERENCES
- (1).World Health Organization. WHO Model List of Essential Medicines 19th List (April 2015). http://www.who.int/medicines/publications/pharmacopoeia (accessed Mar 19, 2018).
- (2).Drugs.com. Warfarin for Injection https://www.drugs.com/drugshortages/%0Dwarfarin-for-injection-1110 (accessed Mar 19, 2018).
- (3).Drugs.com. Warfarin Sodium Tablets https://www.drugs.com/drugshortages/%0Dwarfarin-sodium-tablets-908 (accessed Mar 19, 2018).
- (4).ASHP. Warfarin for Injection, ASHP-Pharmacists Advancing Healthcare https://www.ashp.org/drug-shortages/current-shortages/drug-shortageslist?%0Dpage=CurrentShortages (accessed Mar 19, 2018).
- (5).Zhangazha W Zim Hit by a Massive Drug Shortage; Zimbabwe: Independent, May 2015. [Google Scholar]
- (6).Moore TJ; Furberg CD; Mattison DR; Cohen MR Quarter Watch: Monitoring FDA MedWatch Reports, 2015; pp 1–21. [Google Scholar]
- (7).Centers for Disease Control and Prevention (CDC). Underlying Cause of Death 1999−2013 on CDC WONDER Online Database https://wonder.cdc.gov/ucdicd10.%0Dhtml (accessed Mar 19, 2018).
- (8).Adamo A; Beingessner RL; Behnam M; Chen J; Jamison TF; Jensen KF; Monbaliu J-CM; Myerson AS; Revalor EM; Snead DR; Stelzer T; Weeranoppanant N; Wong SY; Zhang P On-Demand Continuous-Flow Production of Pharmaceuticals in a Compact, Reconfigurable System. Science 2016, 352, 61–67. [DOI] [PubMed] [Google Scholar]
- (9).Monbaliu J-CM; Stelzer T; Revalor E; Weeranoppanant N; Jensen KF; Myerson AS Compact and Integrated Approach for Advanced End-to-End Production, Purification, and Aqueous Formulation of Lidocaine Hydrochloride. Org. Process Res. Dev 2016, 20, 1347–1353. [Google Scholar]
- (10).Zhang P; Weeranoppanant N; Thomas DA; Tahara K; Stelzer T; Russell MG; O’Mahony M; Myerson AS; Lin H; Kell LP.; Jense KF.; Jamiso TF.; Da C.; Cu Y.; Brigg N.; Beingessne RL.; Adam A. Advanced Continuous Flow Platform for On-Demand Pharmaceutical Manufacturing. Chem. Eur. J 2018, 24, 2776–2784. [DOI] [PubMed] [Google Scholar]
- (11).Porta R; Benaglia M; Puglisi A Flow Chemistry: Recent Developments in the Synthesis of Pharmaceutical Products. Org. Process Res. Dev 2016, 20, 2–25. [Google Scholar]
- (12).Hessel V Novel Process Windows - Gate to Maximizing Process Intensification via Flow Chemistry. Chem. Eng. Technol 2009, 32, 1655–1681. [Google Scholar]
- (13).Van Gerven T; Stankiewicz A Structure, Energy, Synergy, Time - The Fundamentals of Process Intensification. Ind. Eng. Chem. Res 2009, 48, 2465–2474. [Google Scholar]
- (14).Jiménez-González C; Poechlauer P; Broxterman QB; Yang B-S; am Ende D; Baird J; Bertsch C; Hannah RE; Dell’Orco P; Noorman H; Yee S; Reintjens R; Wells A; Massonneau V; Manley J Key Green Engineering Research Areas for Sustainable Manufacturing A Perspective from Pharmaceutical and Fine Chemicals Manufacturers. Org. Process Res. Dev 2011, 15, 900–911. [Google Scholar]
- (15).Squibb Bristol-Myers. COUMADIN-Warfarin Sodium Injection, Powder, Lyophilized, for Solution. Dly. Med, 2011; pp 1–39. [Google Scholar]
- (16).Rahman Z; Korang-Yeboah M; Siddiqui A; Mohammad A; Khan MA Understanding Effect of Formulation and Manufacturing Variables on the Critical Quality Attributes of Warfarin Sodium Product. Int. J. Pharm 2015, 495, 19–30. [DOI] [PubMed] [Google Scholar]
- (17).Kasim NA; Whitehouse M; Ramachandran C; Bermejo M; Lennernas̈ H; Hussain AS; Junginger HE; Stavchansky SA; Midha KK; Shah VP; Amidon GL Molecular Properties of WHO Essential Drugs and Provisional Biopharmaceutical Classification. Mol. Pharm 2004, 1, 85–96. [DOI] [PubMed] [Google Scholar]
- (18).Sheth AR; Young VG; Grant DJW Warfarin Sodium 2-Propanol Solvate. Acta Crystallogr., Sect. E: Struct. Rep. Online 2002, 58, m197–m199. [Google Scholar]
- (19).Sheth AR; Brennessel WW; Young VG; Muller FX; Grant DJW Solid-State Properties of Warfarin Sodium 2-Propanol Solvate. J. Pharm. Sci 2004, 93, 2669–2680. [DOI] [PubMed] [Google Scholar]
- (20).Hilfiker R Polymorphism in the Pharmaceutical Industry; Wiley-VCH, 2006. [Google Scholar]
- (21).Hiskey CF; Melnitchenko V Clathrates of Sodium Warfarin. J. Pharm. Sci 1965, 54, 1298–1302. [DOI] [PubMed] [Google Scholar]
- (22).Karusala NR; Kishore JA; Bandari M; Gorantla SR A Process for the Preparation of Warfarin Sodium. U.S. Patent 044,246 A2, October 9, 2007. [Google Scholar]
- (23).Bristol-Myers-Squibb. Warfarin Full Prescribing Information http://www.accessdata.fda.gov/drugsatfda_docs/label/2011/009218s107lbl.pdf (accessed Feb 22, 2018).
- (24).Weldele M; Delmarre D; Gao D; El-Khateeb MA; Centeno C-JS; Pathak SR Stable Warfarin Sodium Liquid Formulation and Method of Making Same. U.S. Patent 7,259,185 B2, 2007. [Google Scholar]
- (25).United States Pharmacopeia. Warfarin Sodium for Injection; USP, 2015; Vol. 38, pp 5802–5804. [Google Scholar]
- (26).Long B; Li J; Song Y; Du J Temperature Dependent Solubility of R-Form L -Glutamic Acid in Selected Organic Solvents: Measurements and Thermodynamic Modeling. Ind. Eng. Chem. Res 2011, 50, 8354–8360. [Google Scholar]
- (27).Reus MA; Van Der Heijden AEDM; Ter Horst JH Solubility Determination from Clear Points upon Solvent Addition. Org. Process Res. Dev 2015, 19, 1004–1011. [Google Scholar]
- (28).Gao D; Maurin MB Physical Chemical Stability of Warfarin Sodium. AAPS PharmSci 2001, 3, 18. [DOI] [PMC free article] [PubMed] [Google Scholar]
- (29).National Institute of Standards and Technology. ThermoLit: NIST Literature Report Builder for Thermochemical Property Measurements https://trc.nist.gov/thermolit/main/home.html#property/syssel:2:info;warfarin_sodi%0Dum:info;2-propanol:form/props:3:0:0 (accessed Mar 24, 2018).
- (30).Hong M; Xu L; Ren G; Chen J; Qi M Solubility of Lansoprazole in Different Solvents. Fluid Phase Equilib 2012, 331, 18–25. [Google Scholar]
- (31).Omar W Effect of Solvent Composition on Crystallization Process of Ascorbic Acid. Chem. Eng. Technol 2006, 29, 119–123. [Google Scholar]
- (32).Rosbottom I; Ma CY; Turner TD; O’Connell RA; Loughrey J; Sadiq G; Davey RJ; Roberts KJ Influence of Solvent Composition on the Crystal Morphology and Structure of p-Aminobenzoic Acid Crystallized from Mixed Ethanol and Nitro-methane Solutions. Cryst. Growth Des 2017, 17, 4151–4161. [Google Scholar]
- (33).Lee T; Kuo CS; Chen YH Solubility, Polymorphism, Crystallinity, and Crystal Habit of Acetaminophen and Ibuprofen by Initial Solvent Screening. Pharm. Technol 2006, 10, 72–92. [Google Scholar]
- (34).Mirza S; Miroshnyk I; Heinämäki J; Christiansen L; Karjalainen M; Yliruusi J Influence of Solvents on the Variety of Crystalline Forms of Erythromycin. AAPS PharmSci 2003, 5, 39. [DOI] [PMC free article] [PubMed] [Google Scholar]
- (35).Shekunov BY; York P Crystallization Processes in Pharmaceutical Technology and Drug Delivery Design. J. Cryst. Growth 2000, 211, 122–136. [Google Scholar]
- (36).Chekal BP; Campeta AM; Abramov YA; Feeder N; Glynn PP; McLaughlin RW; Meenan PA; Singer RA The Challenges of Developing an API Crystallization Process for a Complex Polymorphic and Highly Solvating System. Part I. Org. Process Res. Dev 2009, 13, 1327–1337. [Google Scholar]
- (37).Nývlt J Kinetics of Nucleation in Solutions. J. Cryst. Growth 1968, 3, 377–383. [Google Scholar]
- (38).Kaemmerer H; Jones MJ; Lorenz H; Seidel-Morgenstern A Selective Crystallisation of a Chiral Compound-Forming System-Solvent Screening, SLE Determination and Process Design. Fluid Phase Equilib 2010, 296, 192–205. [Google Scholar]
- (39).Vellema J; Hunfeld NGM; Van Den Akker HEA; Ter Horst JH Avoiding Crystallization of Lorazepam during Infusion. Eur. J. Pharm. Sci 2011, 44, 621–626. [DOI] [PubMed] [Google Scholar]
- (40).Zorrilla-Veloz RI; Stelzer T; Loṕez-Mejías V Measurement and Correlation of the Solubility of 5-Fluorouracil in Pure and Binary Solvents. J. Chem. Eng. Data 2018, 63, 3809–3817. [DOI] [PMC free article] [PubMed] [Google Scholar]
- (41).International Council for Harmonisation. Guidance for Industry Q3C; US Health & Human Services Department-Food and Drug Adminsitration, 2017; Vol. 9765, pp 1–8. [Google Scholar]
- (42).Croker DM; Kelly DM; Horgan DE; Hodnett BK; Lawrence SE; Moynihan HA; Rasmuson ÅC Demonstrating the Influence of Solvent Choice and Crystallization Conditions on Phenacetin Crystal Habit and Particle Size Distribution. Org. Process Res. Dev 2015, 19, 1826–1836. [Google Scholar]
- (43).Chen EC; McGuire G; Lee HY Solubility Isotherm of the Ferric Chloride-Magnesium Chloride-Hydrogen Chloride-Water System. J. Chem. Eng. Data 1970, 15, 448–449. [Google Scholar]
- (44).Cabrera AL; Toledo AR; del Valle JM; de la Fuente JC Measuring and Validation for Isothermal Solubility Data of Solid 2-(3,4-Dimethoxyphenyl)-5,6,7,8-Tetramethoxychromen-4-One (Nobiletin) in Supercritical Carbon Dioxide. J. Chem. Thermodyn 2015, 91, 378–383. [Google Scholar]
- (45).Shiflett MB; Harmer MA; Junk CP; Yokozeki A Solubility and Diffusivity of 1,1,1,2-Tetrafluoroethane in Room-Temperature Ionic Liquids. Fluid Phase Equilib 2006, 242, 220–232. [Google Scholar]
- (46).Wang S; Wang J; Yin Q Measurement and Correlation of Solubility of 7-Aminocephalosporanic Acid in Aqueous Acetone Mixtures. Ind. Eng. Chem. Res 2005, 44, 3783–3787. [Google Scholar]
- (47).Mohan R; Lorenz H; Myerson AS Solubility Measurement Using Differential Scanning Calorimetry. Ind. Eng. Chem. Res 2002, 41, 4854–4862. [Google Scholar]
- (48).Wei T; Wang C; Du S; Wu S; Li J; Gong J Measurement and Correlation of the Solubility of Penicillin V Potassium in Ethanol + Water and 1-Butyl Alcohol + Water Systems. J. Chem. Eng. Data 2015, 60, 112–117. [Google Scholar]
- (49).Guo L; Wang Y; Tu L; Li J Thermodynamics and Phase Equilibrium of the System CsCl-MgCl2-H2O at 298.15 K. J. Chem. Eng. Data 2017, 62, 1397–1402. [Google Scholar]
- (50).Shakeel F; Shazly GA; Haq N Solubility of Metoclopramide Hydrochloride in Six Green Solvents at (298.15 to 338.15) K. J. Chem. Eng. Data 2014, 59, 1700–1703. [Google Scholar]
- (51).Dwyer L; Kulkarni S; Ruelas L; Myerson A Two-Stage Crystallizer Design for High Loading of Poorly Water-Soluble Pharmaceuticals in Porous Silica Matrices. Crystals 2017, 7, 131. [Google Scholar]
- (52).Roa Engel CA; Ter Horst JH; Pieterse M; Van Der Wielen LAM; Straathof AJJ Solubility of Fumaric Acid and Its Monosodium Salt. Ind. Eng. Chem. Res 2013, 52, 9454–9460. [Google Scholar]
- (53).Smallwood IM Handbook of Organic Solvent Properties; Arnold: London, Great Britain, 1996. [Google Scholar]
- (54).Guo Y; Yin Q; Hao H; Zhang M; Bao Y; Hou B; Chen W; Zhang H; Cong W Measurement and Correlation of Solubility and Dissolution Thermodynamic Properties of Furan-2-Carboxylic Acid in Pure and Binary Solvents. J. Chem. Eng. Data 2014, 59, 1326–1333. [Google Scholar]
- (55).Pascual GK; Donnellan P; Glennon B; Kamaraju VK; Jones RC Experimental and Modeling Studies on the Solubility of 2-Chloro-N-(4-Methylphenyl)Propanamide (S1) in Binary Ethyl Acetate + Hexane, Toluene + Hexane, Acetone + Hexane, and Butanone + Hexane Solvent Mixtures Using Polythermal Method. J. Chem. Eng. Data 2017, 62, 3193–3205. [Google Scholar]
- (56).Wang X; Qin Y; Zhang T; Tang W; Ma B; Gong J Measurement and Correlation of Solubility of Azithromycin Monohydrate in Five Pure Solvents. J. Chem. Eng. Data 2014, 59, 784–791. [Google Scholar]
- (57).Rahman Z; Mohammad A; Akhtar S; Siddiqui A; Korang-Yeboah M; Khan MA Chemometric Model Development and Comparison of Raman And13C Solid-State Nuclear Magnetic Resonance-Chemometric Methods for Quantification of Crystalline/Amorphous Warfarin Sodium Fraction in the Formulations. J. Pharm. Sci 2015, 104, 2550–2558. [DOI] [PubMed] [Google Scholar]
- (58).Ahuja S; Scypinski S Handbook of Modern Pharmaceutical Analysis, 2nd ed.; Academic Press: Amsterdam, 2011; Vol. 10. [Google Scholar]
- (59).Brittain HG Polymorphism in Pharmaceutical Solids, 2nd ed.; Informa Healthcare, USA, Inc, 2009. [Google Scholar]
- (60).Tian Y; Booth J; Meehan E; Jones DS; Li S; Andrews GP Construction of Drug−Polymer Thermodynamic Phase Diagrams Using Flory−Huggins Interaction Theory: Identifying the Relevance of Temperature and Drug Weight Fraction to Phase Separation within Solid Dispersions. Mol. Pharm 2013, 10, 236–248. [DOI] [PubMed] [Google Scholar]
- (61).Giron D Thermal Analysis and Calorimetric Methods in the Characterisation of Polymorphs and Solvates. Thermochim. Acta 1995, 248, 1–59. [Google Scholar]
- (62).Yan H; Wang Z; Wang J Correlation of Solubility and Prediction of the Mixing Properties of Capsaicin in Different Pure Solvents. Ind. Eng. Chem. Res 2012, 51, 2808–2813. [Google Scholar]
- (63).Buchowski H; Ksiazczak A; Pietrzyk S Solvent Activity along a Saturation Line and Solubility of Hydrogen-Bonding Solids. J. Phys. Chem 1980, 84, 975–979. [Google Scholar]
- (64).Filippa MA; Gasull EI Ibuprofen Solubility in Pure Organic Solvents and Aqueous Mixtures of Cosolvents: Interactions and Thermodynamic Parameters Relating to the Solvation Process. Fluid Phase Equilib 2013, 354, 185–190. [Google Scholar]
- (65).Millard JW; Alvarez-Núñez FA; Yalkowsky SH Solubilization by cosolvents. Int. J. Pharm 2002, 245, 153–166. [DOI] [PubMed] [Google Scholar]
- (66).Jouyban A Review of the Cosolvency Models for Predicting Solubility of Drugs in Water-Cosolvent Mixtures. J. Pharm. Pharm. Sci 2008, 11, 32–58. [DOI] [PubMed] [Google Scholar]
Associated Data
This section collects any data citations, data availability statements, or supplementary materials included in this article.