
Fig. 5. Identification of MRAP2 regions required for the inhibition of β-arrestin recruitment to GHSR1a.
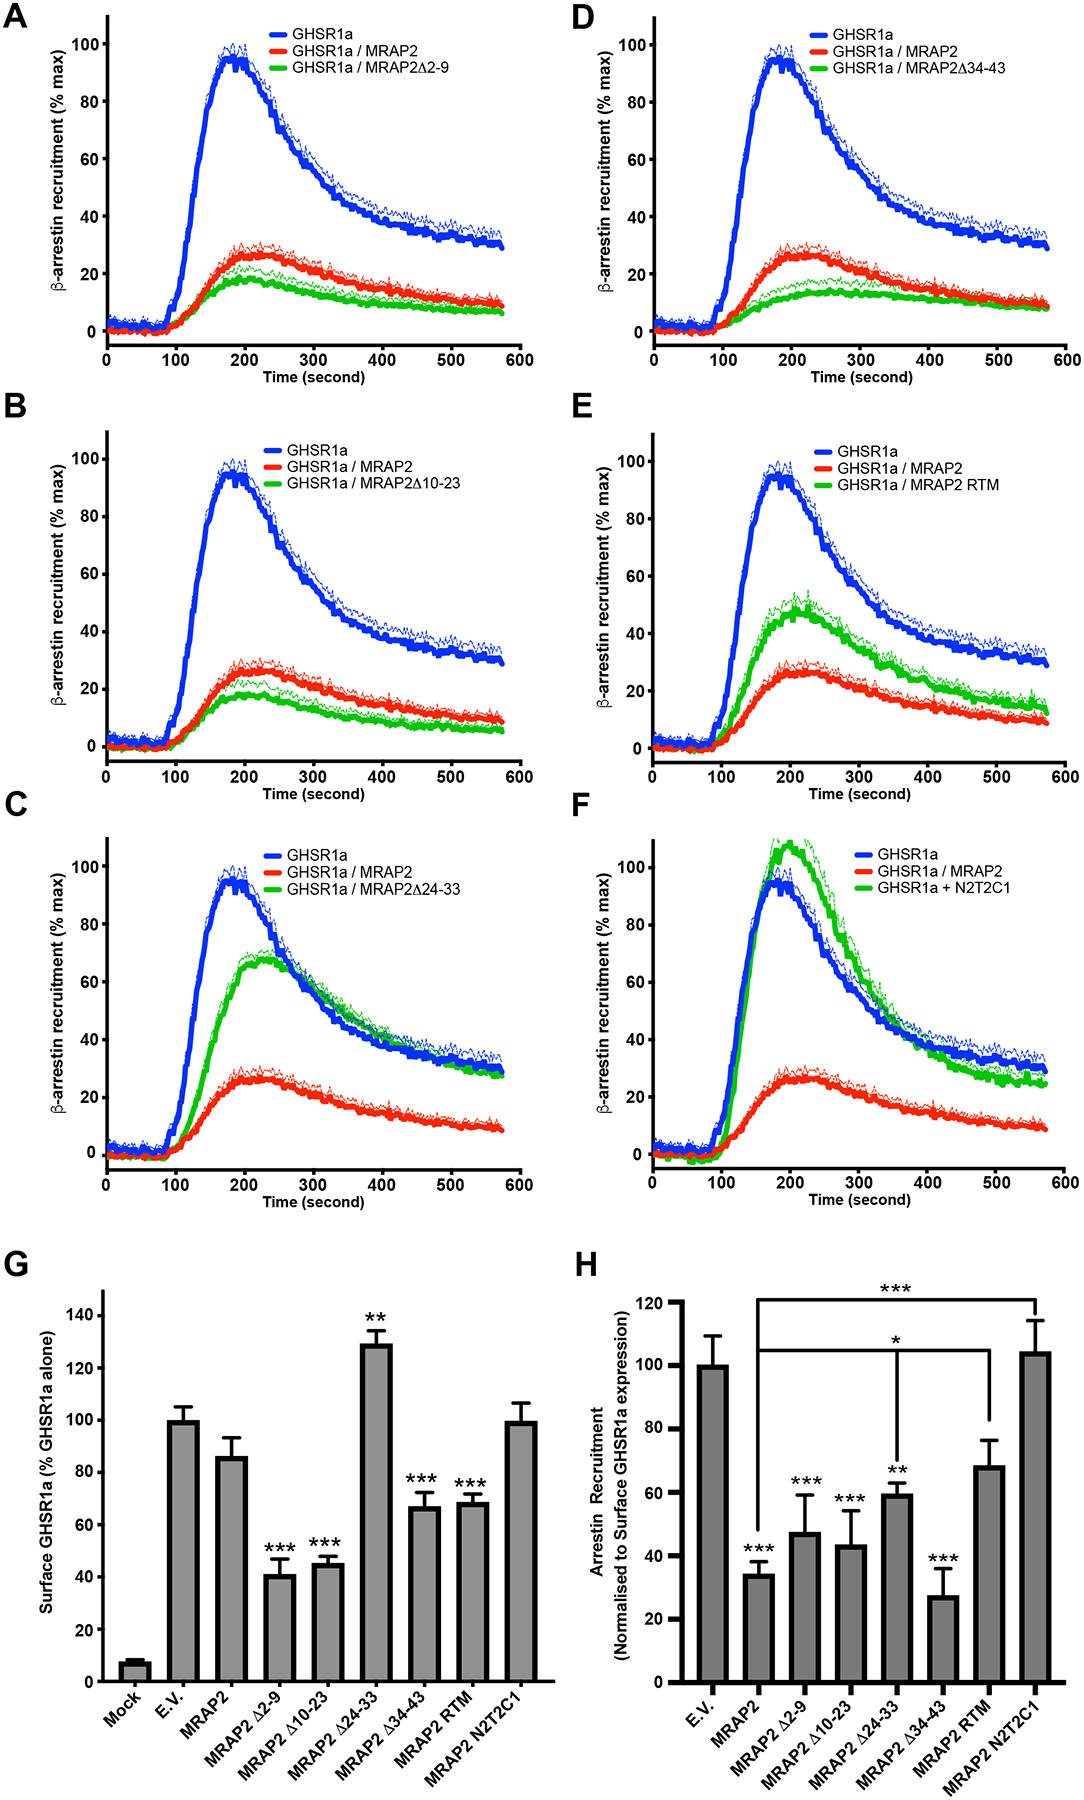
(A to F) Kinetics of ghrelin-stimulated β-arrestin recruitment to GHSR1a in CHO cells transfected with GHSR1a-LgBiT, SmlBiT-β-arrestin2 and empty vector, MRAP2 or the indicated MRAP2 mutant. Statistical analysis of the differences at each ghrelin concentrations were measured by T-test. Data represent the mean +/− SEM of 3 independent experiments performed in triplicate. (G) Surface density of GHSR1a measured by fixed-cell ELISA in each of the condition tested for β-arrestin recruitment. Statistical analysis was done using one-way ANOVA. Data represent the mean +/− SEM of 3 independent experiments performed in triplicate. (H) Area under the curve of β-arrestin recruitment normalized to the surface expression of GHSR1a for each condition tested. Statistical analysis was done using one-way ANOVA. Data are shown as mean +/− SEM of the percentage of normalized β-arrestin recruitment in the absence of MRAP2. *p<0.05, **p<0.01, ***p<0.001.