
FIGURE 3.
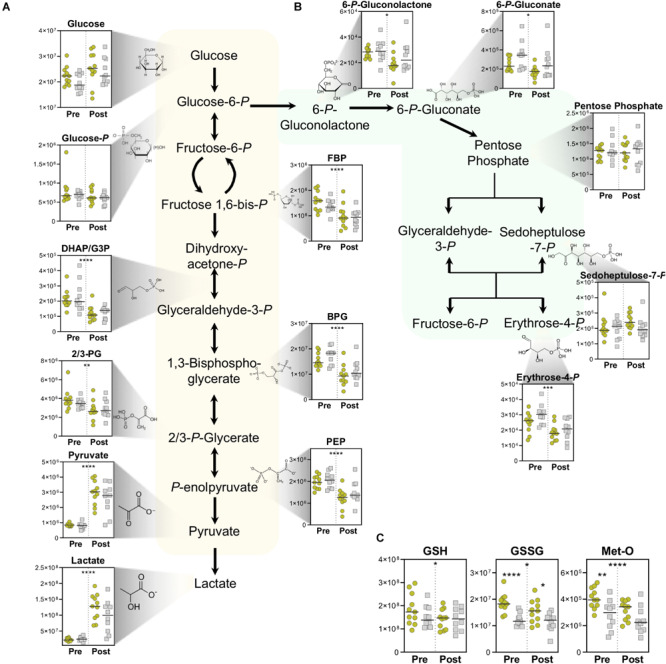
Energy and Redox Metabolism. Metabolite abundances (y-axis, Peak Area (AU)) are plotted for (A) Glycolysis, (B) pentose phosphate pathway, and (C) Reduced (GSH) and oxidized (GSSG) glutathione, as well as oxidative-stress derived methionine sulfoxide (Met-O). Samples from the Gold (°) and Silver (□) groups are shown Pre and Post exercise test (divided by a dotted line). p-values from a two-tailed paired T-test of comparisons between the Pre and Post time points using combined Gold/Silver group values are shown above the dashed line. p-values from a two-tailed unpaired homoscedastic T-test comparing the Gold and Silver groups at each time point are shown on the respective side of the dashed line. *p < 0.05; **p < 0.01; ***p < 0.001; ****p < 0.0001.