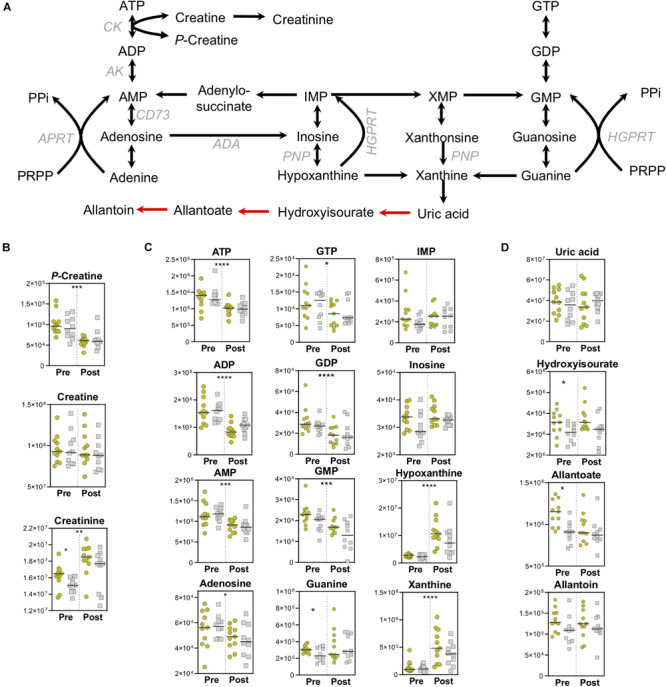
FIGURE 5.

High-Energy Phosphates and Purine Metabolism. (A) A pathway map for high-energy phosphate and purine homeostasis is shown. Spontaneous, non-enzymatic reactions are shown in red arrows. Metabolite abundances [y-axis, Peak Area (AU)] are plotted for (B) Creatine homeostasis, (C) Purine salvage, and (D) Purine catabolism. Samples from the Gold (°) and Silver (□) groups are shown Pre and Post exercise test (divided by a dotted line). p-values from a two-tailed paired T-test of comparisons between the Pre and Post time points using combined Gold/Silver group values are shown above the dashed line. p-values from a two-tailed unpaired homoscedastic T-test comparing the Gold and Silver groups at each time point are shown on the respective side of the dashed line. *p < 0.05; **p < 0.01; ***p < 0.001; ****p < 0.0001.
