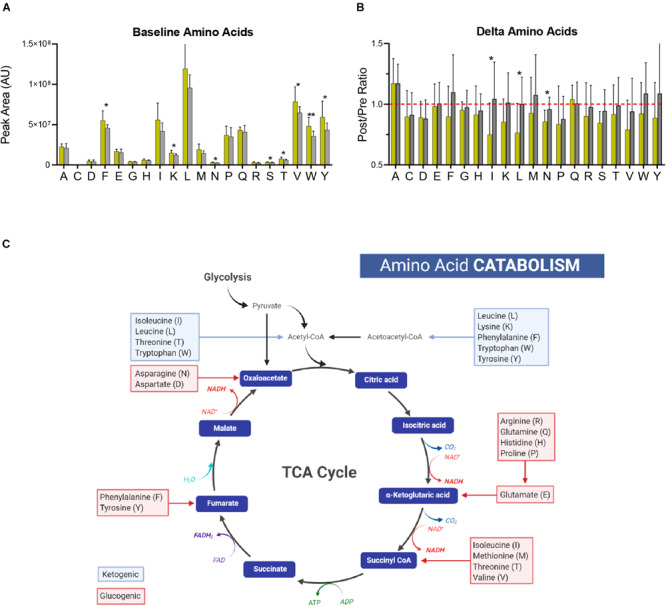
FIGURE 6.

Amino Acid Catabolism. (A) The baseline (pre-training) levels of amino acids (labeled with single letter code) are shown for the Gold and Silver performance groups. (B) Fold changes of amino acid levels (Post/Pre) for both performance groups are shown. A ratio of 1 is indicated by a dashed red line. (C) A generalized schematic of amino acid catabolism through the TCA cycle is shown. Glucogenic amino acids, which have the capacity to fuel gluconeogenesis, are listed in red boxes. Ketogenic amino acids, which contribute to acetoacetate and acetyl-CoA pools, are listed in blue boxes. p-values from a two-tailed Student’s T-test are shown as *p < 0.05; **p < 0.01; ***p < 0.001; ****p < 0.0001.
