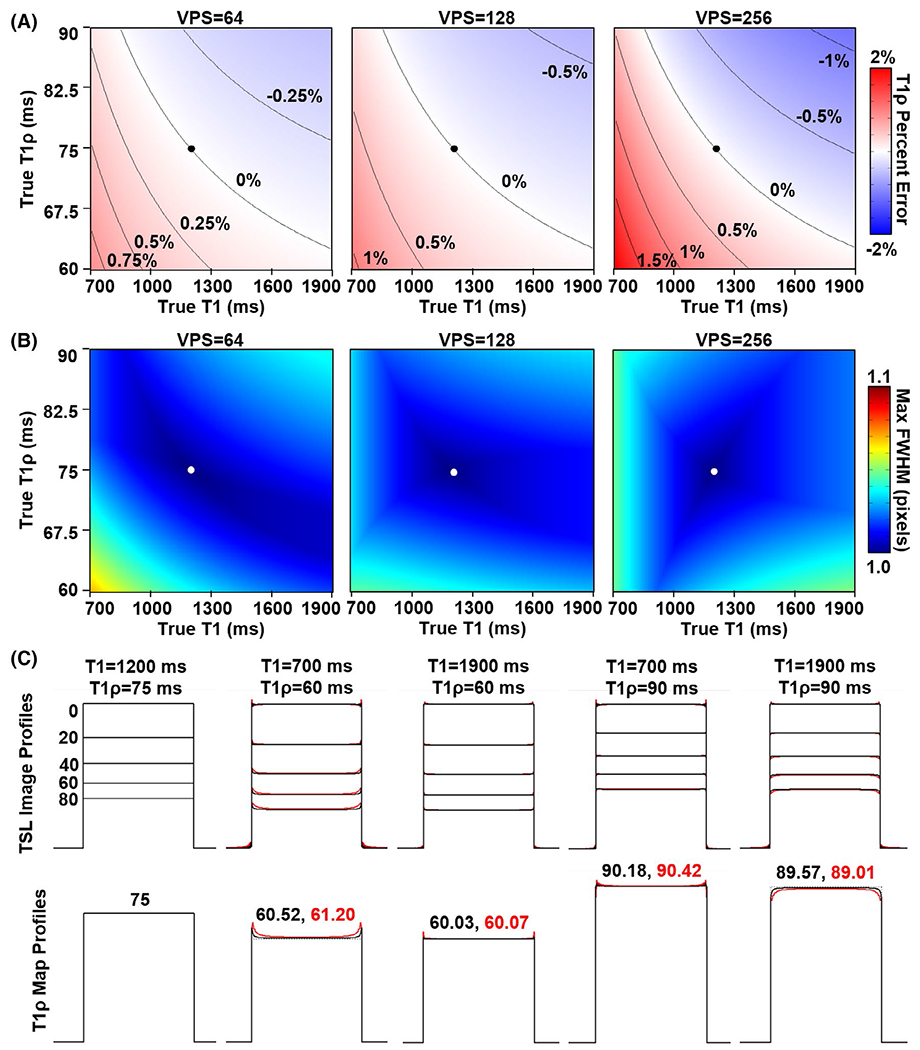
FIGURE 4.

Simulated percent error in measured T1ρ relaxation times and spatial blurring using tailored VFA scheduling. The dots mark the assumed T1 (1200 ms) and T1ρ (75 ms) relaxation times when calculating the tailored VFA schedules. A, Plots of T1ρ percent error as a function of the true T1 and T1ρ relaxation times of brain tissue after fitting five TSLs (0, 20, 40, 60, and 80 ms) to a mono-exponential decay curve. The T1ρ quantification error increases as VPS increases but is ≤ 2% up to VPS = 256. B, Plots of the maximum FWHM values across all TSL image point spread functions (PSFs). There is relatively little PSF blurring with FWHM ≤ 1.07 pixels for all cases. C, Simulated image and T1ρ map profiles. The leftmost plot is for the ideal case, where the true T1 and T1ρ relaxation times match those assumed when generating the tailored VFA schedules (corresponding to the dots in [A] and [B]). The next four plots are the extreme pairs of T1 and T1ρ values used for the simulations (corresponding to the corners of the plots in (A) and (B)). Black lines are for VPS = 64 and red lines are for VPS = 256. The T1ρ relaxation times in the middle of the map profiles are indicated above the plots for both VPS = 64 (black font) and VPS = 256 (red font)
