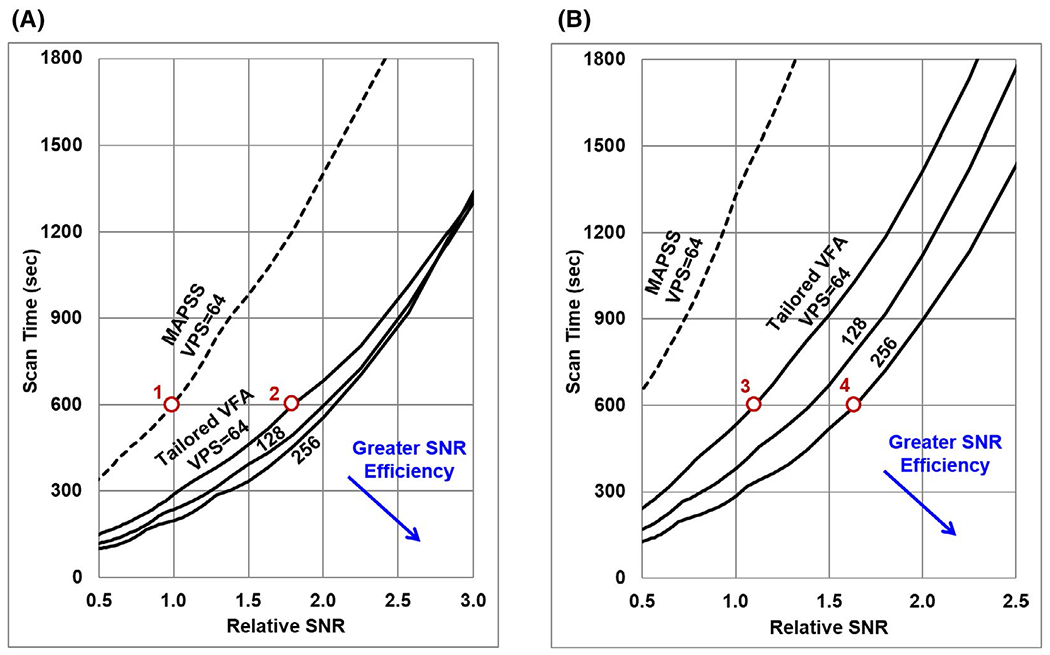
FIGURE 5.

Simulated T1ρ map relative SNR versus scan time for 3D T1ρ mapping acquisitions, assuming the base 3D mapping parameters listed in Table 1. Results are plotted for acquisitions without (A) and with (B) CSF nulling applied. The MAPSS technique (dashed line) requires greater scan time than tailored VFA scheduling (solid lines) to achieve a given T1ρ SNR. The SNR efficiency of tailored VFA scheduling improves as VPS increases (lines are shown for VPS = 64, 128, and 256), whereas the SNR efficiency of MAPSS is optimized near VPS = 64. Points along these curves corresponding to the data sets acquired for the in vivo 3D T1ρ mapping experiment (Table 2) are indicated by the circles and labeled with the corresponding data set number
