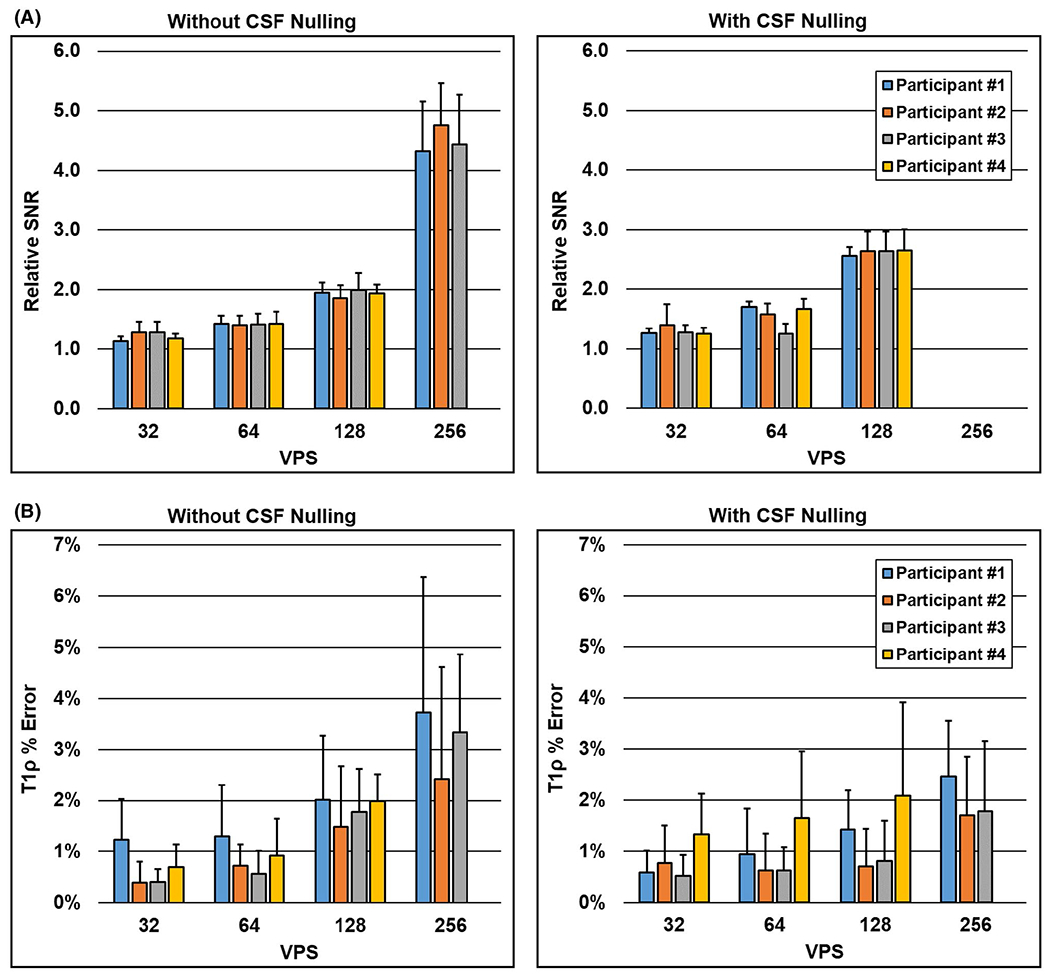
FIGURE 7.

Region of interest (ROI) analysis of the relative SNR and T1ρ percent error of the in vivo 2D T1ρ maps acquired with tailored VFA scheduling versus MAPSS. Each colored bar is 1 of the 4 participants, and each bar plots the mean and SD across the eight ROIs (Supporting Information Figure S4). A, Relative SNR increased with VPS, yielding greater than 4× SNR using tailored VFA scheduling versus MAPSS at VPS = 256. B, Average absolute T1ρ percent error was 2% or less up to VPS = 128. Furthermore, T1ρ errors were generally lower when CSF nulling was applied
