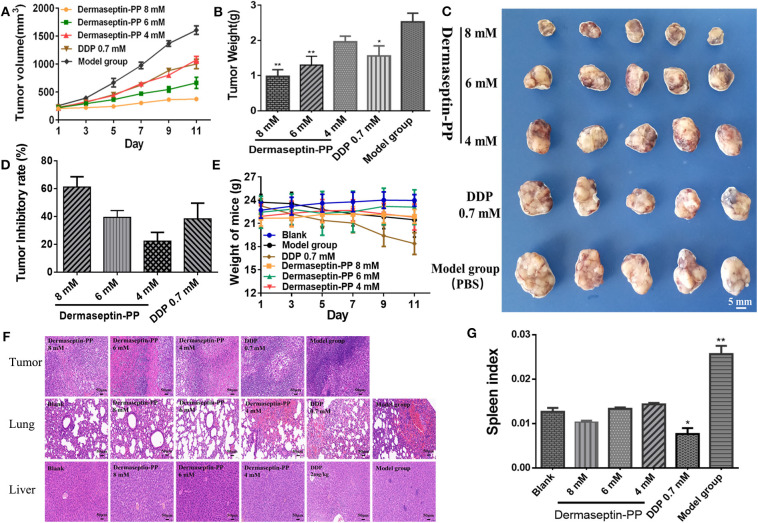
Figure 5.
(A) Tumor volume of all administration groups measured every 2 days with SEMs shown as error bars around the mean of each data point. (B) The quantification tumor weight of the excised tumor of all administration groups. Data was analyzed with unpaired Student's t-test using GraphPad Prism 5 software. **P < 0.01, *P < 0.05 vs. model group (PBS). (C) The images of the excised tumor of all administration groups. (D) Tumor inhibitory rate of Dermaseptin-PP and DDP. The data represent means ± SEM (standard error of the mean). (E) Every 2-day weight changes of mice in each group during the experiment with SEMs shown as error bars around the mean of each data point. (F) Representative images of HE staining (×200) of isolated tumor, lung and liver of different administration groups to evaluate the tissue histological conditions. (G) The calculated spleen index of mice in different groups. Data was analyzed with unpaired Student's t-test using GraphPad Prism 5 software. **P < 0.01, *P < 0.05 vs. blank control group.

