Figure 6.
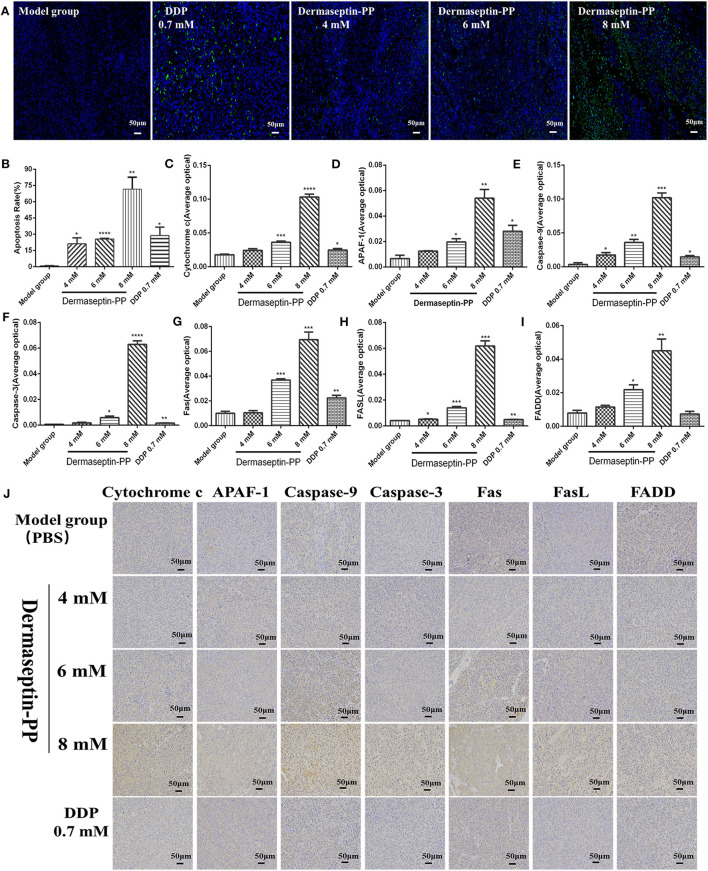
Representative images (A) and histological images analysis (B) of TUNEL staining for detection of apoptosis in H157 cells (×200). The yellow-green stained cells in the nucleus are positive (apoptotic) cells and the blue-stained cells in the nucleus are normal cells. Data was analyzed with unpaired Student's t-test using GraphPad Prism 5 software. ****P < 0.0001, **P < 0.01, *P < 0.05 vs. model control group (PBS). The immunohistochemical analysis was used to determine the expression of (C) Cytochrome c (D) Apaf-1 (E) Caspase-9 (F) Caspase-3 (G) Fas (H) FasL (I) FADD in tumor tissue isolated from mice treated under various conditions. ****P < 0.0001, ***P < 0.001, **P < 0.01, *P < 0.05 vs. model control group (PBS). (J) The representative images of immunohistochemical. Original magnification, ×200. The deeper the yellow, the higher the apoptosis-related protein expression. The average optical density (AOD) of each tumor tissue section was analyzed by Image-Pro Plus software and is shown in the bar graph on the right of the images. The higher the AOD, the higher the level of the apoptosis protein. Data was analyzed with unpaired Student's t-test using GraphPad Prism 5 software. **P < 0.01, *P < 0.05 vs. model control group.

