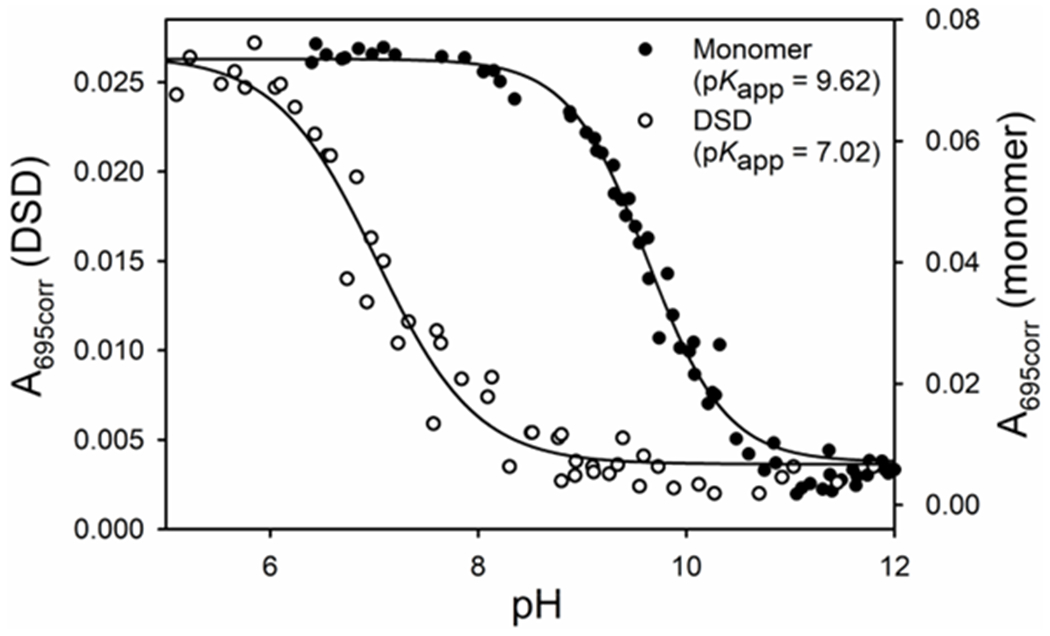
Figure 2.

Plot of A695corr versus pH for the alkaline transition for monomeric (closed circles) and DSD (open circles) cytc. Data were collected at room temperature (22 ± 3 °C) in 100 mM NaCl solution with a protein concentration of 100 μM heme (100 μM monomer or 50 μM dimer). Solids lines are fits to eq 2 in materials and methods.
