Figure 4.

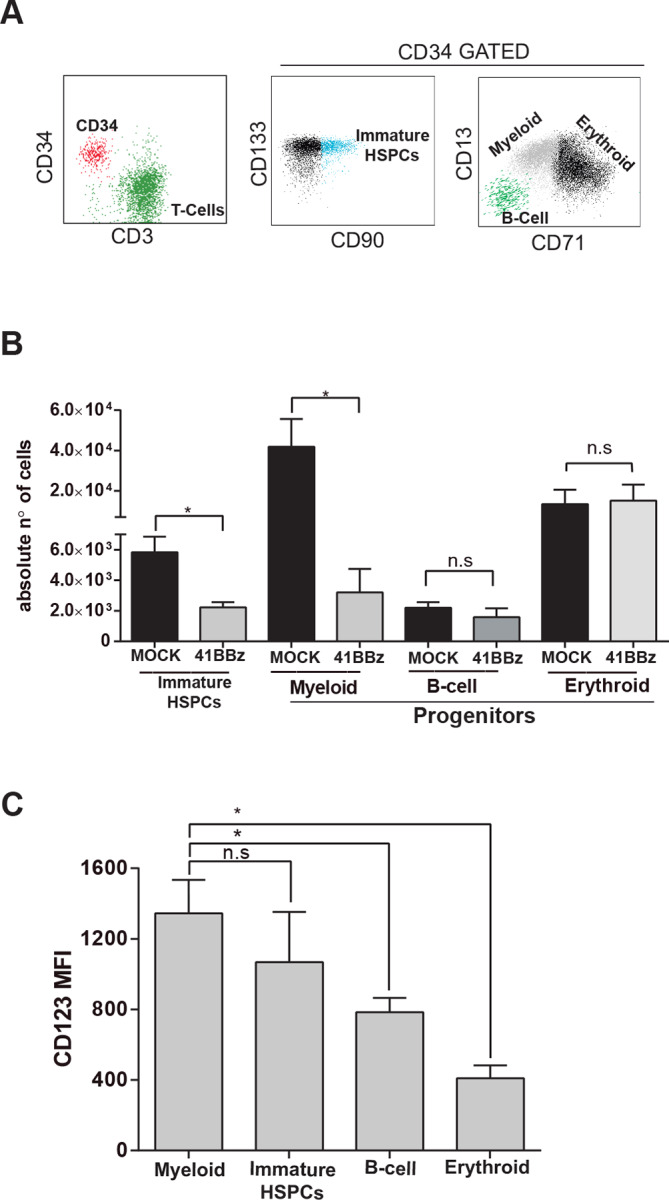
CAR123-mediated cytotoxicity is CD34 subset specific. (A) Flow cytometry characterization of different subsets of CD34+ HSPCs post CD123 CART exposure. Left: identification of CD34+ HSPCs and CD123 CARTS. Middle right: identification of CD90+ CD133+ early-immature CD34+ HSPCs (turquoise dots), CD13−CD71−CD19+ B-lymphoid CD34+ HSPCs (green dots), CD13++CD71 dim myeloid CD34+ HSPCs (gray dots) and CD13lowCD71++ erythroid CD34+ HSPCs (black dots). (B) Absolute quantification by FACS of the different CD34+ subsets (as identified in A) on exposure to CD123 CARTS or MOCK T-cells (48 hours, E:T 1:1) (n=3). (C) MFI levels of CD123 in the different CD34+ cell subsets (n=3). *P<0.05. CART, chimeric antigen receptor T-cell; FACS, fluorescence-activated cell sorting; MFI, mean fluorescence intensity.
