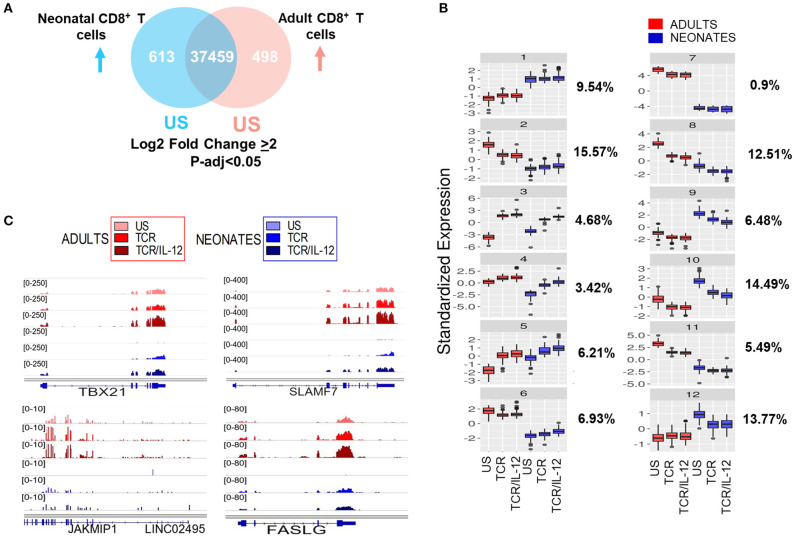
Figure 2.
Basal levels and response patterns of differentially expressed genes between neonatal and adult CD8+ T cells. (A) Venn diagram of differentially expressed genes between naïve neonatal and adult naïve CD8+ T (adjusted p < 0.05 and Log2 fold change ≥ 2). (B) k-means clustering of the pattern expression of genes, based in their base levels and response to TCR or TCR/IL-12 treatment in neonatal and adult CD8+ T cells. The percentage of genes belonging to each cluster is shown to the left. (C) Genome browser screenshots of RNA-seq data, showing four genes (TBX21, SLAMF7, JAKMIP1, and FASLG) from Cluster 4 that reached the adult's expression level in neonates stimulated cells.

