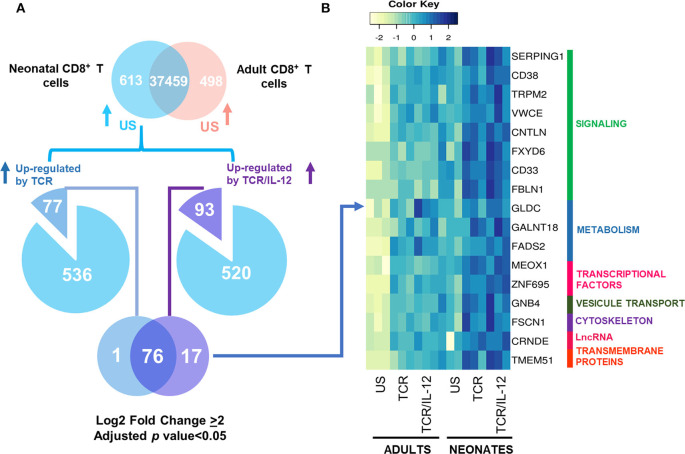
Figure 6.
Genes Overexpressed in neonatal CD8+ T cells and showing an exacerbated response to TCR/IL-12 signals. (A) Venn Diagrams showing the genes analyzed and (B) heatmaps with manual annotation of the genes with an exacerbated response to TCR and TCR/IL-12 signals in the neonatal CD8+ T cells (adjusted p < 0.05 and log2 fold change ≥ 2).

