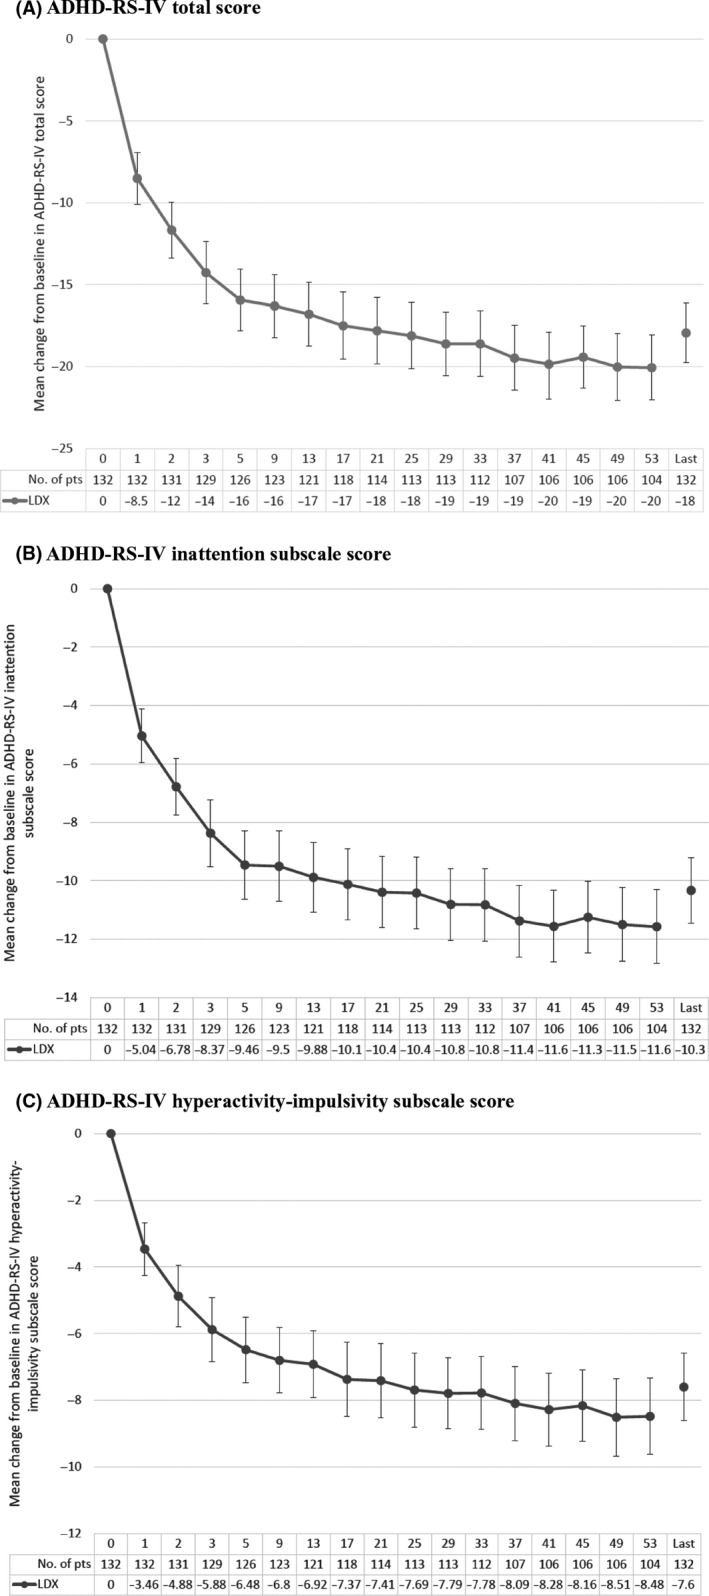
Figure 3.

Changes from baseline in ADHD‐RS‐IV scores (mean ± 95% confidence intervals). A, Total score; B, Inattention subscale score; C, Hyperactivity‐impulsivity subscale score. Data tabulated beneath the figures are study week number, then numbers of patients (pts) at each time point, and then mean decrease from baseline in ADHD‐RS‐IV total score with lisdexamfetamine (LDX)
